Is It The Site, Or Is It The Analytics? Debugging Google Analytics
As I’ve said in previous columns, marketers can no longer rely on their communication skills alone to get the job done. They must become scientists of a sort, skilled at measuring and reporting on their digital properties. The tools now exist to help us learn so much about our visitors. But, to paraphrase a famous […]
As I’ve said in previous columns, marketers can no longer rely on their communication skills alone to get the job done. They must become scientists of a sort, skilled at measuring and reporting on their digital properties.
The tools now exist to help us learn so much about our visitors. But, to paraphrase a famous quote, “With great power comes great potential to screw up.”
The only thing more heartbreaking than a poor converting website is a high-converting website with broken analytics. Are you getting the credit you deserve? Is a bad analytics setup hiding your true performance?
I think you’re ready, and I never want to underestimate a marketer. So, here are the basic tools needed to debug your Google Analytics setup. Google Analytics Debbugger and JavaScript Console.
The Tools Of The Trade
Below are the details needed for your Google Analytics setup through the Chrome Browser and Chrome Web Store.
Chrome Browser
It’s understandable that Google would be partial to their own browser. Two of the key tools we’ll use only run in Chrome.
Tag Assistant (by Google) Extension
You’ll find this extension in the Chrome Web Store.
The Tag Assistant Extension in the Chrome Web Store
The Tag Assistant Extension is great for locating issues with your website.
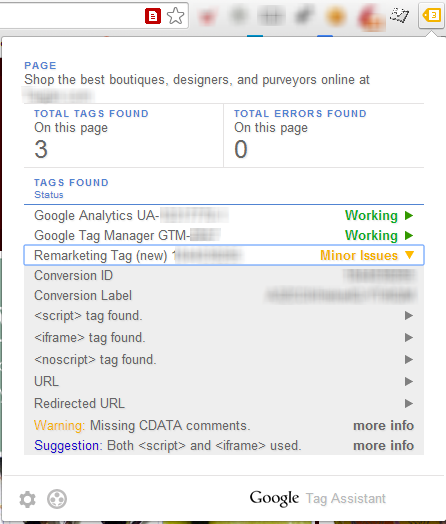
Tag Assistant reports on issues that might affect the accuracy of your analytics data.
This extension provides great detail and links to help documents that explain any problem you may be having. Even if your webmaster or IT department does all of your setup, this is your first line of defense against improper implementation.
Be sure to run Tag Manager on the key pages of your site, not just the home page. Check your cart, your landing pages, your thank you pages, and any other pages key to your conversion funnel.
Google Analytics Debugger
You’ll find the Analytics Debugger extension in the Chrome Web Store as well.
The Google Analytics Debugger Extension in the Chrome Web Store
The Analytics Debugger works in tangent with another feature of Chrome, the JavaScript Console.
Don’t fret about this feature. You’ll soon appreciate the information it reveals to you.
When installed, the Analytics Debugger icon ![]() appears in your Chrome toolbar. By clicking this, you “turn on” the debugger and the icon
appears in your Chrome toolbar. By clicking this, you “turn on” the debugger and the icon ![]() will reflect that.
will reflect that.
Your browser will be refreshed as a special debug version of the Google Analytics libraries is loaded. Other than the change in the icon, you should notice nothing — until you open your JavaScript Console.
JavaScript Console
The JavaScript Console is built into the Chrome browser. Its primary job, for our purposes, is to display messages from the web pages loaded into the browser.
You can invoke it by typing Ctrl-Shift-J on a Windowsian machine and ![]() on a Macaroni. Or choose Tools –> JavaScript Console from the Chrome menu.
on a Macaroni. Or choose Tools –> JavaScript Console from the Chrome menu.
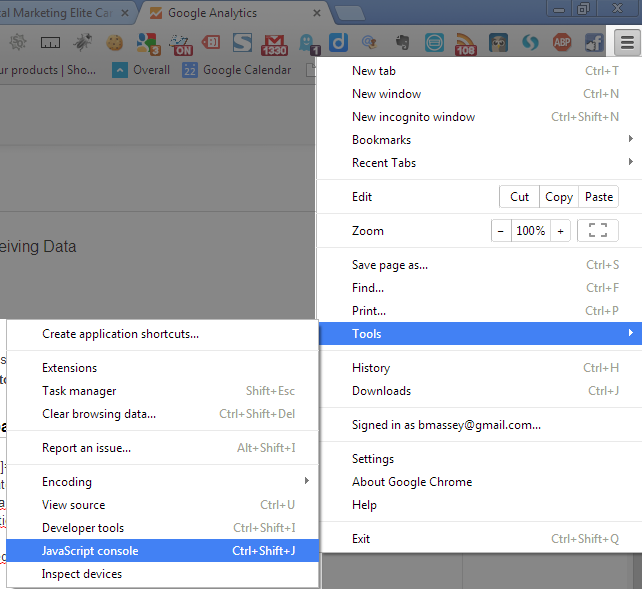
Opening the JavaScript Console using the Menu.
Now, refresh the page again.
If your Google Analytics Debugger is on, the gibberish that will fill the screen could only be appreciated by a developer’s mother. I don’t know what 80% of this stuff means, and you won’t have to either.
There are two primary kinds of information your site will send to Google Analytics:
- Pageviews
- Events
When a pageview is sent to the Google Analytics servers, you’ll see this appear in the JavaScript Console:
Track Pageview
Likewise, when an Event is sent, you’ll see:
Track Event
Scroll through the debug detritus until you see one of these markers. Following this is a block of indecipherable stuff, which is then followed by the details you can use.
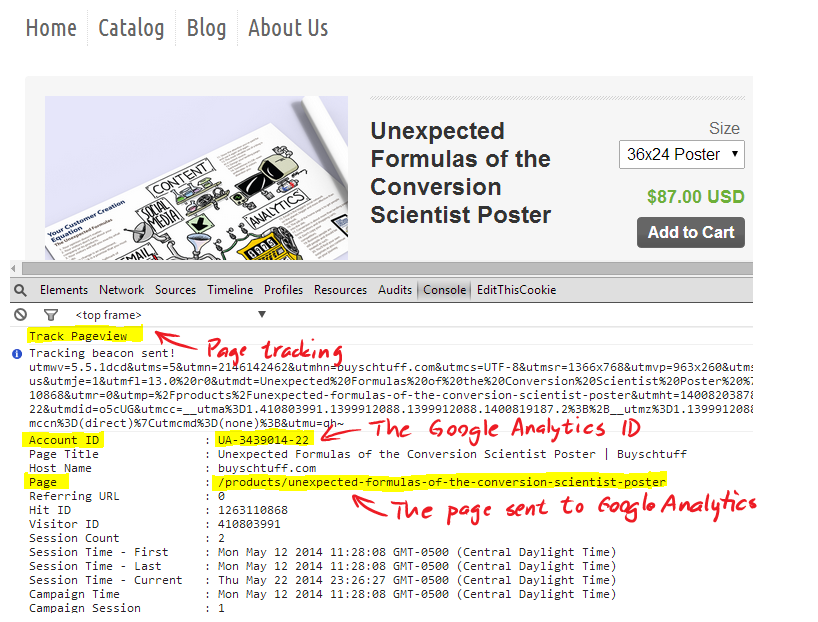
Every page should generate a basic Track Pageview call to Google Analytics. (Click to enlarge.)
In our sample store at BuySchtuff.com, we added a Google Analytics Event to the “Add to Cart” button so we could see when someone added an item to the cart. Here’s the debug output that verifies the event is being called.
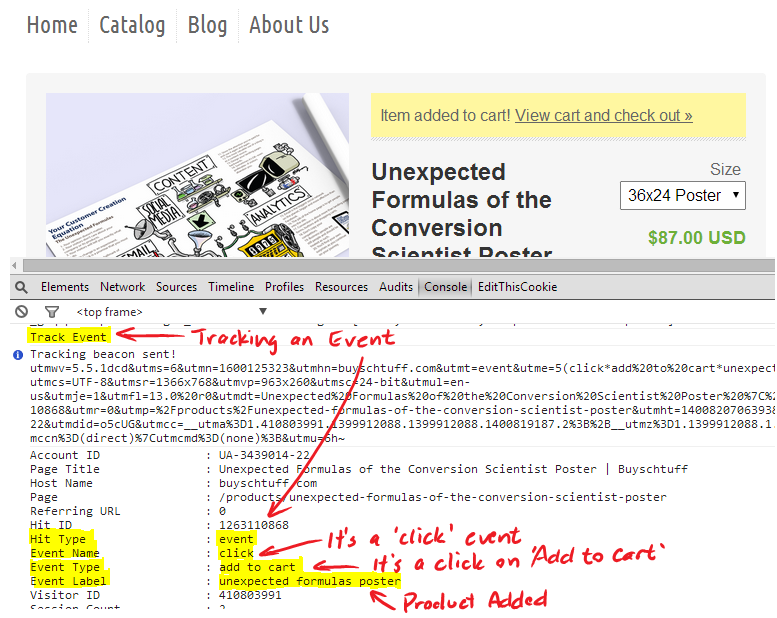
The debugger confirms that our “Add to Cart” event is being triggered. (Click to enlarge.)
If these events are showing up in the debugger, you can be reasonably sure they are making it to Google Analytics.
Even information on custom variables can be found in the “Track Pageview” record:
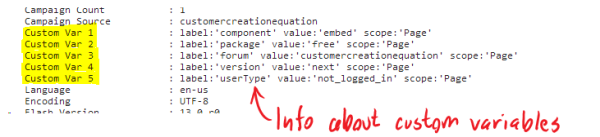
Custom Variable data is shown in the debugger under “Track Pageview”
One More Example
In my last column, Using A Google Tag Manager Listener To Get Your Real Bounce Rate, I showed you how to use a Timer Listener in Google Tag Manager to send Google Analytics an Event if a visitor remains on a page for 15 seconds or more.
To be sure this event is firing on your site, these tools would provide the confidence you need.
- Click on the Tag Assistant Extension icon to be sure that there are no implementation errors.
- Turn on Google Analytics Debugger.
- Open the JavaScript Debugger.
- Visit a page on your site. Here we’re just visiting the home page.
- Wait 15 seconds.
- Look for the ‘Track Event’ message in the Console output.
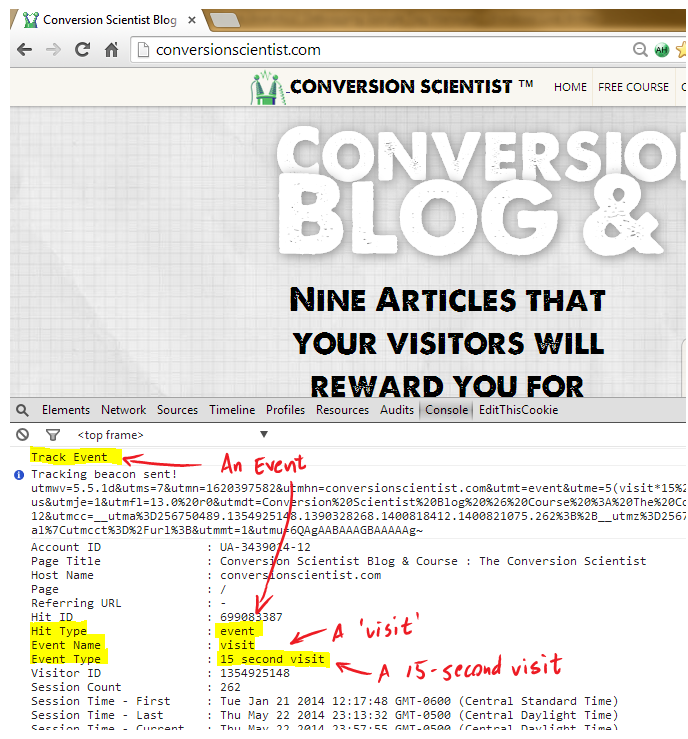
You’ll have to wait the full 15 seconds before you can verify that this event is being triggered. (Click to enlarge.)
Managing Console Output
Here are just a couple of tips on managing all of the gibberish spewing from your browser at this point.
You may be frustrated that your debugging output disappears when you click on something that takes you to a new page. This can be fixed.
Simply right click inside the JavaScript Console window to reveal this popup menu. By checking ‘Preserve log upon navigation” you can prevent your debug information from disappearing as you surf a site.
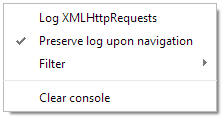
However, this is going to fill your JavaScript Console with deblather (debugging blather). At times, you will want to just clear it all out. Do that by clicking on “Clear console.”
You already saw that, didn’t you. See, you’re getting it!
Even More Data From Google Tag Manager
The debugger also gives you feedback on your Google Tag Manager (GTM) implementations. Here’s a snippet showing that GTM is executing the 15-second timer event on our blog.
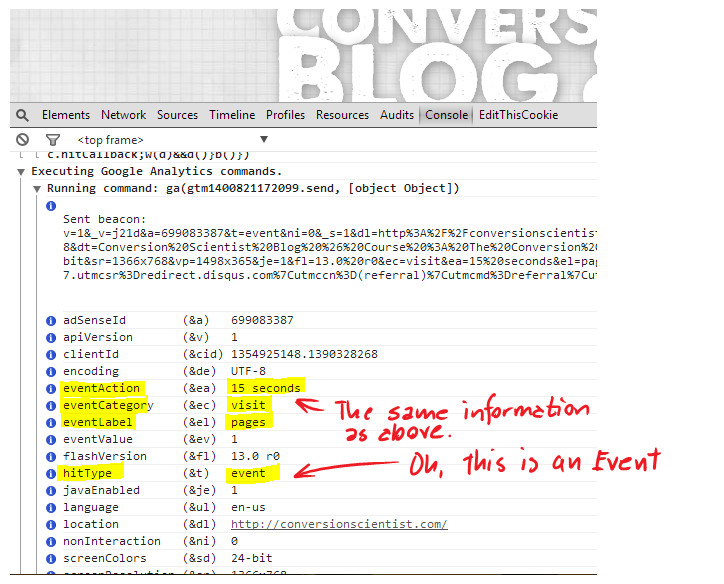
You can verify that Google Tag Manager is working using the debugger. (Click to enlarge.)
Even if you’re not doing the analytics implementation yourself, you now have the tools to ensure that the data you are getting from your website is accurate. Good data means good decisions.
What are your favorite debugging tools and tricks? Let us know in the comments.
Contributing authors are invited to create content for MarTech and are chosen for their expertise and contribution to the search community. Our contributors work under the oversight of the editorial staff and contributions are checked for quality and relevance to our readers. MarTech is owned by Semrush. Contributor was not asked to make any direct or indirect mentions of Semrush. The opinions they express are their own.
Related stories
About the author