How Did Yahoo Regain Number One Status In The US? Turns Out, No One’s Sure
It was big news last month. For the first time since May 2011, Yahoo was the top network for unique visitors in the United States, edging out Google. What caused this reversal? After doing some digging, there’s apparently no clear-cut answer, nor is Yahoo providing one, other than Marissa Mayer took over. But let’s explore […]
![]() It was big news last month. For the first time since May 2011, Yahoo was the top network for unique visitors in the United States, edging out Google. What caused this reversal? After doing some digging, there’s apparently no clear-cut answer, nor is Yahoo providing one, other than Marissa Mayer took over. But let’s explore what we can.
It was big news last month. For the first time since May 2011, Yahoo was the top network for unique visitors in the United States, edging out Google. What caused this reversal? After doing some digging, there’s apparently no clear-cut answer, nor is Yahoo providing one, other than Marissa Mayer took over. But let’s explore what we can.
Yahoo Resurges
I’ll start with a chart. Below, as provided by ratings service comScore, is the number of unique visitors in the United States to the Yahoo and Google networks, for each month going back to November 2009.
Network means all properties that they own combined into one. Flickr counts into Yahoo’s network; YouTube counts into Google’s network. The scale is in millions of visitors (250 = 250 million). This is for desktop visitors, not mobile visitors — something I’ll get back to later:
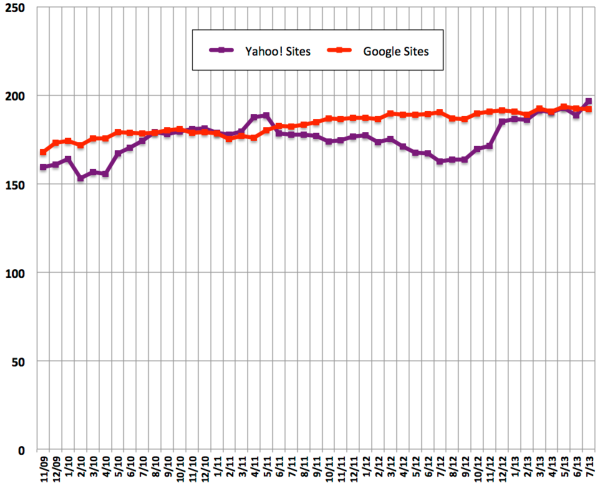
Yahoo’s dip can be seen beginning in June 2011. The decline largely continued until about a year ago, when an amazing reversal happened after Mayer was named as Yahoo’s new CEO in July 2013.
Close Up: The Mystery Growth Spurts
Here’s the scale shortened, so you can better see important growth moments (click to enlarge it even more):
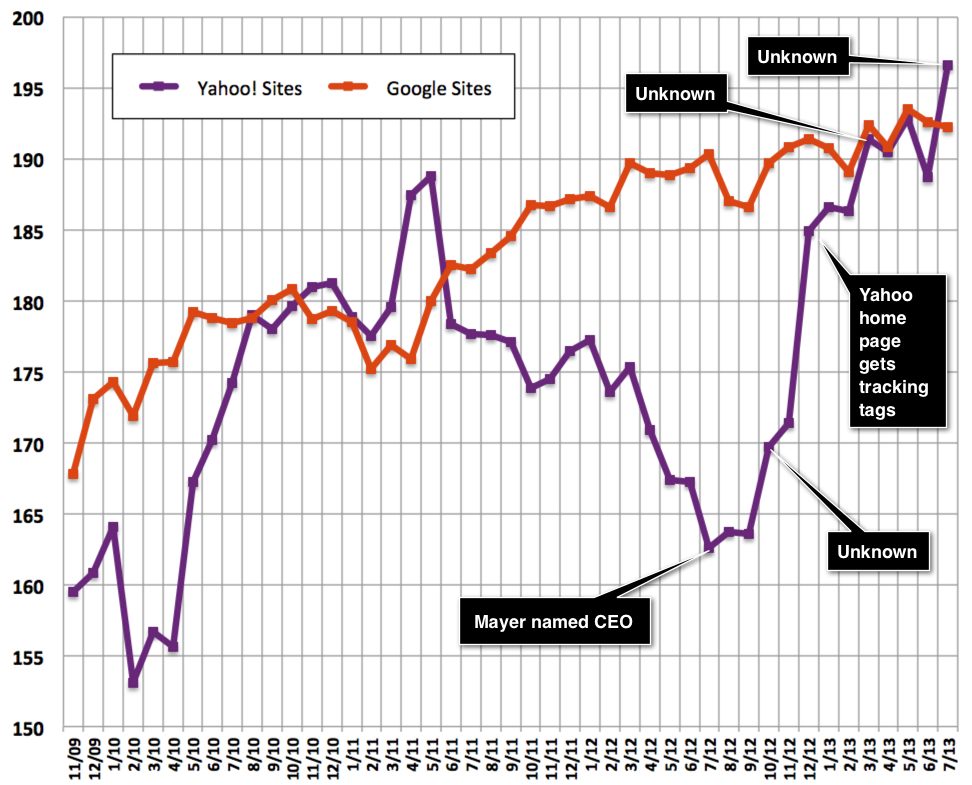
The close-up view makes it easier to see the four major “growth spurts” that helped Yahoo’s network regain its number one spot:
- September to October 2012, up 3.7% or 6.1 million visitors
- November to December 2012, up 7.9% or 13.5 million visitors
- February to March 2013, up 2.7% or 5.1 million visitors
- June to July 2013, up 4.2% or 7.8 million visitors
December 2012: New comScore Tracking Code = Big Gain
What caused these spurts to happen? Yahoo had no comment about them. Talking with comScore further, it only shed light on one of them. Figures for December 2012 onward reflect a better estimate of unique visitors to Yahoo’s home page, because of new comScore tracking code that was added.
comScore forms its estimates in two ways. It has a panel of people that allow comScore to track what they do on their computers, a sample that’s used to estimate visits for the overall Internet population or within particular countries.
comScore also uses a tracking code, which if installed on websites allows comScore to see all the requests and visits that happen to those sites. The tracking code allows for better estimates. And as it turns out, comScore says that it had been undercounting traffic to Yahoo’s home page for some time, since Yahoo hadn’t used that code.
In short, Yahoo’s biggest gain wasn’t really a gain at all. Yahoo likely had a big chunk of visitors already at the site which just weren’t being counted properly.
What Caused The Other Spikes?
Mystery solved? Not quite. It seems that as most, comScore had been uncounting 13.5 million visitors per month for Yahoo’s home page. That’s the difference between the November to December 2012 figures. What if figures from before the tracking code was installed were corrected to make up for the undercount? Would Yahoo have been above Google’s network well before the July 2013 turnaround?
Nope. Look at this chart, which adds that extra 13.5 million going back to January 2012:

Even making the most optimistic estimate of how Yahoo’s home page traffic might have been undercounted, Yahoo’s unique visitors were still in decline before Mayer arrived, and Yahoo still had three other growth spurts that ultimately pushed it above Google.
New Ad Network Helped In October 2012?
The first of the jumps happened from September to October 2012, an increase of 6.1 million visitors. Reason for the gain? One candidate comes to mind. Yahoo relaunched a contextual ad network at the end of September. Maybe traffic from some of the sites in that network are contributing to Yahoo’s overall network total?
That’s just a guess. It could be many other things. With neither comScore nor Yahoo talking, we really don’t know.
Updated Home Page Made For March 2013 Gains? Or NBC Sports?
Another big jump happened from February to March 2013, a gain of 5.1 million visitors. Perhaps the new Yahoo home page launched in late February brought in and helped retain some new visitors?
Maybe. Maybe not. Again, that’s just a guess. Neither Yahoo nor comScore, as noted earlier, had any explanation for the leap.
Another possibility is that some traffic at NBC Sports actually counts to Yahoo, comScore told me, thanks to a deal that happened in mid-December 2012. Maybe some of the increase came as part of that kicking in?
Yahoo News Behind July 2013 Spike?
The last of the big jumps is most recent, a gain of 7.8 million visitors from June to July 2013. What might have caused this? Maybe there was a rush of people seeking those inactive usernames that Yahoo opened up in July. If so, it’s likely that would be one-time traffic that will lead to an August decline.
Yahoo also relaunched Yahoo News at the end June, which potentially brought in many more new visitors during July.
What Didn’t Cause It: Flickr, Tumblr & Search
Other things that might have helped? If you’re thinking Flickr, think again. Despite Flickr giving people 1TB of storage in late May 2013, unique visitors for the following month went down, not up.
Tumblr would give Yahoo a huge increase in unique visitors, one that would put it even further ahead of Google. However, comScore doesn’t count Tumblr as part of Yahoo’s traffic. Why not? Because Yahoo hasn’t asked comScore to do that, I was told.
Maybe that will happen in the future, but the main takeaway is that Tumblr doesn’t count for any of the visitor gains noted above.
As for search, Yahoo’s share keeps dropping. Yahoo had 12.8% of the US search share in August 2012; the most recent comScore figures show that as 11.4% for August 2013, a decrease.
What Also Didn’t Cause It: Anything In Particular!
If you’re feeling exhausted at this point trying to understand what’s behind Yahoo’s gains, believe me, I’m with you. I didn’t think it would be this complicated. But comScore is limited as to how much data it will release, not wanting paying clients to feel like the public gets too much for free.
That includes providing a list of Yahoo’s top properties. I initially figured that would be the easiest way to spot what was behind Yahoo’s rise. Just look at the top five properties within the network a year ago compared to now. Did any show major increases, making them stand-out as starts? Nor would Yahoo provide such stats, either.
Enter SimilarWeb, which got in touch with us after our initial story on Yahoo topping Google. It uses data gathered from various plug-ins that people use (see more about them from TechCrunch here). That data gives these top properties for Google and Yahoo for US visits, comparing July 2012 to July 2013:

An important caveat. SimilarWeb is using visits, not unique visitors, as comScore does. Any visitor in a particular month might do several visits to a particular property. In fact, that’s one of the downsides to unique visitor figures. They show potential audience but not frequency of usage by that audience. A person who goes to one place only once in a given month gets counted the same as someone who visits another place several times per day.
Having said this — and assuming you trust SimilarWeb’s data — none of Yahoo’s leading properties (apparently Yahoo, then Tumblr and Flickr) have posted any major gains.
What Also Didn’t Cause It: Mobile
The comScore charts above all are only for desktop-traffic, so things you’ve heard about Yahoo making gains in mobile usage don’t come into play with them. Something happened to bring in more desktop users.
For the curious, the chart below also comes from figures that comScore provided. The first set of higher lines show unique visitors (in millions) going to either Google or Yahoo month-by-month on either desktop or mobile devices, a combined figure. The set of lines below are the desktop-only figures:
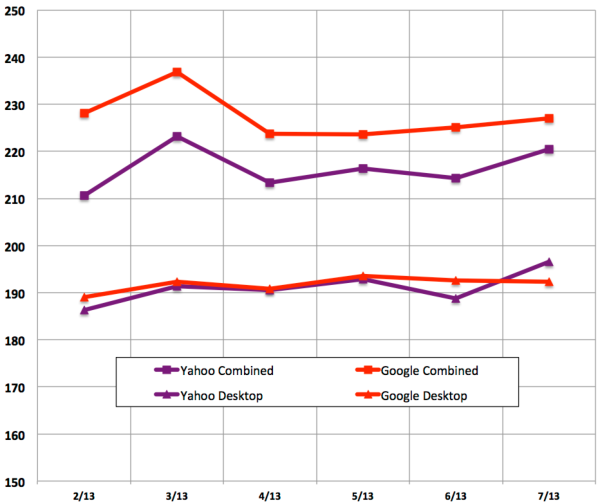
The combined figures shed no real light on what drove those desktop increases. All it really shows is that on a combined basis, Yahoo still has some catching-up to do against Google.
Yahoo: We’re Up 20%
Still scratching your head trying to understand the gain? As I said above, I did ask Yahoo for what it saw as causing the spikes. The response:
We have seen a 20% increase since Marissa started, and we now have over 800 million monthly active users, excluding Tumblr….
We’re seeing additional usage on mobile (which we now have more than 350M monthly users), the Homepage, Mail, Search and our other core properties.
Maybe Yahoo has seen small gains across the board since Mayer revitalized the company, enough to make it tip past Google according to comScore’s figures. That doesn’t explain some of those traffic spikes, however. And unfortunately, there seems to be no good explanation coming.
Related Articles
- Yahoo #1 Web Property Again In US, First Time Since May 2011
- Yahoo! Debuts! New! Logo!
- The New Yahoo News, Now With More Homepage
- Behind Flickr’s New Pricing: Yahoo Really Wants To Show More Ads
- Yahoo Surpasses 300 Million Monthly Mobile Users In Q1
- August Search Market Share Grinds To Standstill, Though Google & Bing Grow In Volume
Contributing authors are invited to create content for MarTech and are chosen for their expertise and contribution to the search community. Our contributors work under the oversight of the editorial staff and contributions are checked for quality and relevance to our readers. MarTech is owned by Semrush. Contributor was not asked to make any direct or indirect mentions of Semrush. The opinions they express are their own.
Related stories
About the author