ComScore: Value And CPMs Are Out Of Whack
Not only are an average of 31% of display ads never even seen, but there’s little to no correlation between the CPMs sites are charging and the value they’re delivering to the advertisers — where value is defined as ads being viewed and delivered to the primary demographic target. That’s the conclusion of the full […]
Not only are an average of 31% of display ads never even seen, but there’s little to no correlation between the CPMs sites are charging and the value they’re delivering to the advertisers — where value is defined as ads being viewed and delivered to the primary demographic target. That’s the conclusion of the full study comScore released today, which looked at 1.8 billion impressions in 18 campaigns run by advertisers including Allstate, Chrysler, Discover, E-Trade, Ford, General Mills, Kellogg’s, Kimberly Clark, Kraft, and Sprint.
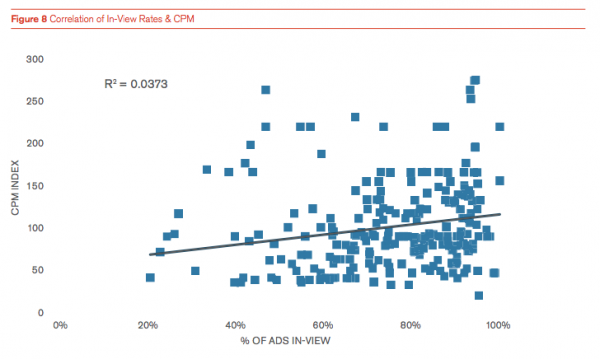
The vCE Charter Study was conducted by comScore in December of 2011. The researchers say ad placements with high in-view rates (meaning ads are likely to be viewed, rather than simply loaded out of sight) are not commanding higher CPMs than those with low in-view rates. Additionally, ads successfully delivered to the advertiser’s primary demographic target do not necessarily come with the deserved higher price tag. The researchers concluded that sites are not being compensated enough for being able to deliver ads in-view and to the right audience. One could also see this as indicating that some of the higher CPMs being charged are not justified.

In-View Varies Even On One Site
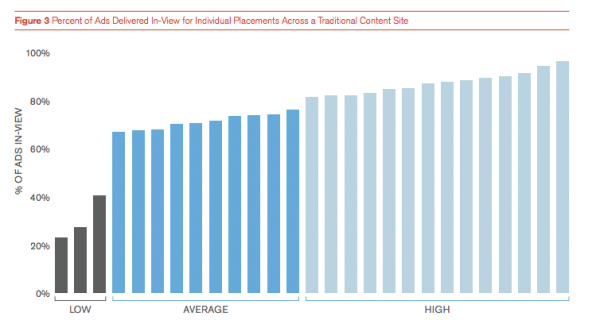
Interestingly, even on a single site, in-view rates differed significantly from placement to placement. On one content site measured (but not named), the majority of placements delivered ads that were viewed 80% of the time, while one-third of the placements delivered between 66% and 65% of ads in view. The rest of the placements dragged down the average, with in-view rates of as little as 23%.

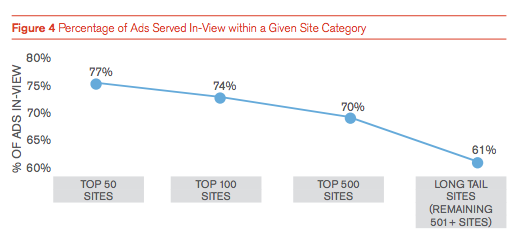
In-view rates also differed markedly between sites of different sizes. The top-50 sites, perhaps because they are more sophisticated and depend more on ad revenue, delivered 77% of ads in view, on average, while long-tail sites only delivered 61% of ads in view.

Above-The-Fold Isn’t Always Best
Contrary to what one might expect, in-view rates didn’t always correlate to whether ads were “above the fold” or “below the fold” on a particular page. The researchers speculated that this was because the ads at the very top of the page were often scrolled past before they had a chance to load. That said, on average, above-the-fold placements did seem to be more likely to be in-view.

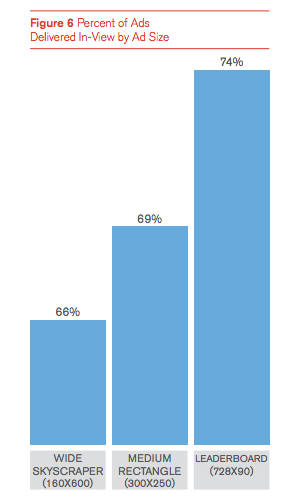
The leaderboard format performed the best when it came to being in-view (74%), while medium rectangles were in-view 69% of the time, and wide skyscrapers came in at 66%. This could be because of where the ads are typically placed, or simply because the leaderboards are larger, and therefore more likely to be on the page at any one time. (The IAB recently adopted larger standard ads.)

MarTech is owned by Semrush. We remain committed to providing high-quality coverage of marketing topics. Unless otherwise noted, this page’s content was written by either an employee or a paid contractor of Semrush Inc.
Related stories
