5 New Year’s Resolutions To Get The Most From Your Data
Having lots of data is great, but contributor David Booth reminds us that what counts is what we do with it.

With the new year now upon us, hopefully you’ve begun working on some resolutions for 2015. In addition to exercising more and eating junk food less, here are five more resolutions that should be on your list — to make sure you’re getting the most out of your data this year.
Collect Custom Data
When it comes to collecting data, way too many people get caught up in using the default metrics and dimensions that come standard with many applications. Allowing this to occur can severely limit how you’re able to use your data to make better decisions.
In the world of customer data, for example, your CRM will have a bunch of standard fields for first name, last name, phone, fax, address, etc., but you’ll also be able to customize the tool to your needs by adding items that are specific to your organization.
If you’re in the B2B space, maybe you want some additional fields to track some extra items in a company record: things like revenue, employee count, estimated budgets or specific industry.
If you’re a retailer, you’ll of course want to track things like past purchases and lifetime value, but you also might create some demographic fields to classify the customer further, track the date they signed up for your loyalty program, or even add third party data to the mix.
On the web analytics side of things, it’s more important than ever to define and collect the data you need. Sure, your standard web analytics tools can figure things out like where a visit came from and it can count page views and transactions, but when it comes to slicing and dicing all that data to find those insights you can act on, you’re going to find yourself wanting more.
If you’re an airline, for example, you might want to track the loyalty program status level of the users on your site to see how each level is behaving. A content site can benefit from tracking beyond just the URL: knowing the author, the post date, the category of the article, or even its word count, can help you make better decisions about who should be writing what next.
Tracking whether someone is a newsletter subscriber or a repeat purchaser can help you understand how to better serve both audiences, and integrating your CRM with your web analytics tool can allow you to analyze online behavior against all those rich customer attributes.
Just about every enterprise-grade CRM and web analytics tool allows you to define and track custom data. Taking the time to think through and track what aspects of a customer or digital visitor you want to better understand and react to is not only well worth the investment, it’s also a prerequisite for segmentation and personalization.
Segment Your Users
You know that not everyone who visits your store, your app or your website is exactly the same. Understanding how different groups of prospects and customers interact with your various touch points can be extremely valuable.

You can create segments out of just about any piece of data you’re collecting, and you can then analyze and compare that segment with any other. For example, you might look at a segment of people who visit your website from a mobile app and compare that segment with visitors using a laptop or desktop.
If you find that mobile users tend to do a lot more researching while desktop users tend to complete more purchases, you can use this information to either tailor the mobile experience to the research behavior you’ve uncovered or investigate any issues in your purchasing process that might be keeping mobile users from completing transactions.
You can look at segments from different geographies, segments of sessions that included specific interactions like watching a video or downloading a file, and even segments of visitors coming from different sources of advertising.
And while you can create and analyze segments using all the standard things your web analytics tool will collect, this becomes really powerful when you start to add in custom data. Think about that airline that’s tracking the status level of its users. Creating segments for Silver, Gold and Platinum” can help to understand just how valuable each of these customers are, and how they behave on the website.
Maybe Silver members don’t book flights that often, and as a result they’re not using all those advanced search features that you invested in. It might be that Platinum members are worth so much more to you than any other level that you have some specific offers and campaigns aimed at increasing levels of membership.
If you’ve integrated your CRM with your web analytics tool, you can create segments based on things like lifetime value or average order value, on demographics like age, gender, income and education level, or even on specific attributes that come from third party data vendors.
Segments can become immediately actionable by creating marketing (and remarketing) lists from them, allowing you to craft campaigns with just the right message for just the right segment. Think about a segment of shoppers that have put an item in their shopping cart, but haven’t checked out yet. Or a segment of loyal customers that haven’t visited your website for over a month. These and countless more are great lists for sending a very specific message or special offer.
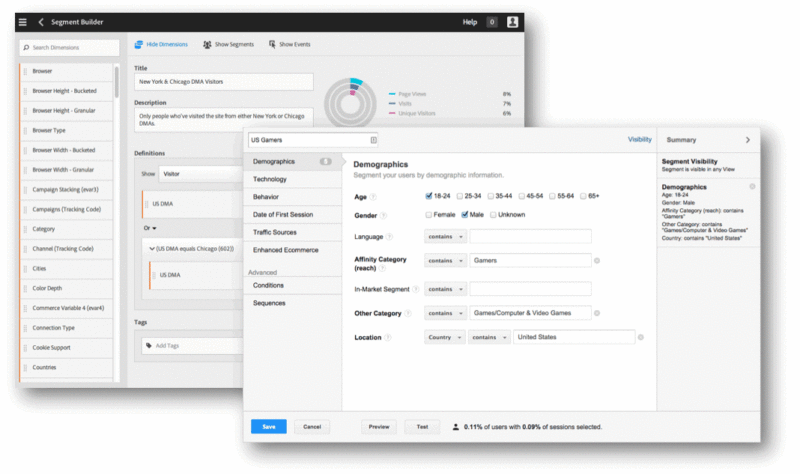
Adobe & Google Analytics Segmentation Interfaces
Most enterprise web analytics tools have pretty sophisticated segmentation features that allow you to create any segment you can dream up with respect to visitors, visits, pages, or even hits using and/or logic and even sequencing. There are lots and lots of great segments to start looking at.
Personalize The Experience
Once you start to create and analyze different segments, you’ll not only be able to understand them better, you’ll be able to customize their experiences with your brand. There are, of course, varying methods and levels of accomplishing this, ranging from some simple rules-based customizations all the way to full blown predictive modeling solutions.
Regardless of where you sit on that spectrum, the point is to start treating your different visitors uniquely. In the ecommerce world, this can be as simple as offering product recommendations: if the user put shoes in their shopping cart, offer them some socks.
Taking it a step further, you might know that this user is also a big-ticket item purchaser, in which case you would offer them some expensive socks.
If you’re a travel website and you know a visitor has a young family, change the image on the homepage to a couple of kids playing on the beach next to their parents. If you know it’s an older, retired, married visitor, then change the picture to an older retired couple walking down that beach.
Many solutions also allow you to incorporate third-party data sets and complex logic into the rules that will drive your customizations. For example, if you’re a restaurant, you could pull real-time weather data into your personalization to feature different menu items — like ice cream when it’s hot outside and hot chocolate when it’s cold. If you’re a financial institution, you could combine stock market data with some customer data to personalize website copy or adjust an offer or promotion.
Whatever your budget and however far you decide to go, investing in personalization can help you to activate those different segments and will pay off by reaching the right people with the right content at just the right time.
Visualize Your Data
One of the most important things you can do with your data to derive value from it is to visualize it in a way that helps you make better decisions. Too often, data gets hidden behind too many logins, clicks, or silos, and, as a result, it never gets used.
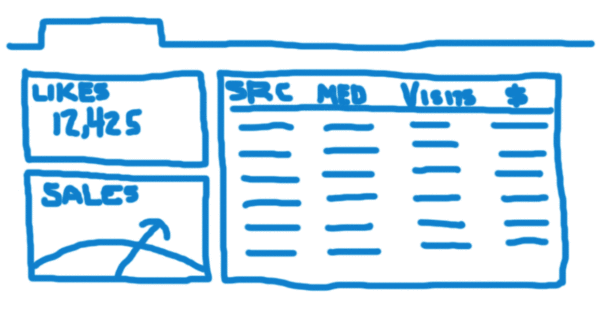
Investing in clean, clear, and purposeful data visualizations helps you to separate the signal from the noise and surface exactly what you need. For example, if you’re trying to make decisions around how to allocate your budget around your social media efforts, there’s lots and lots of data out there that can help you.
For many organizations, that means logging into a dozen different tools and accounts, exporting a bunch of reports and then trying to make them line up with each other, and finally trying to extract some kind of information from it all.
Organizations that have put forward the effort on good visualizations have likely done three things differently:
- They’ve spent time defining the key performance indicators (KPIs) that are not only measurable, but can be clearly tied to business objectives. In this example, these KPIs might include things like total and percentage growth of revenue assisted by each social channel, total revenue per follower/liker/plus-er, and things of that nature.
- They’ve sketched out exactly how they want to see these KPIs reported. This process often starts out on a napkin or a whiteboard. Being familiar with different visualization types can help you decide between heat and tree maps or bar and line charts.
- They’ve automated the data extraction and preparation, which may include different tools to handle things like API connections, extract-transform-load (ETL) processes, cleaning and de-duplicating the data and finally loading into a tool that can make those napkin drawings a reality.
Having these KPIs clearly laid out in a clear dashboard and available on demand not only saves enormous amounts of time, it also makes it extremely clear which social channels are helping your bottom line and which ones aren’t.
And data visualization goes well beyond dashboarding as well. There are many tools that are specifically designed to not only bring in all of your disparate data sets, but also allow you to explore them.
Think about looking at revenue split up by store and geography right alongside television, radio, print, web and app analytics data. Digging deep into all of this data can help you understand the impact of your various marketing efforts on your different success metrics in countless combinations, quickly surfacing winners and losers.
The days of logging into all your accounts to create static reports month after month are behind us, and visualizing data rather than just reporting on it is a key to becoming a truly data-driven organization.
Attribution
Lastly, as we enter 2015, it’s time to start looking at how we attribute value to our various marketing initiatives.
Traditionally, digital marketers have relied on tracking pixels, cookies and analytics tools that tell us when a particular campaign or ad was responsible for some conversion event, whether that’s a sale, a lead, a download or anything else.
And typically, digital marketers have used that data to value and justify spending in each of those channels. The problem is that many of these tools default to attributing value to marketing campaigns in rather unsophisticated ways.
Let’s take an example. Say we have an ecommerce website, and a visitor found us by clicking on a search ad that we placed on a search engine. The visitor browsed around a bit, but didn’t actually buy anything on that first visit. A couple of days later, that same visitor decided to come back, only this time, typed our name into a search engine and clicked on an organic listing.
While on our site, the visitor decides to follow us on a social media channel. A week later, we post an offer to that social media channel and the visitor clicks on it; this time, deciding to sign up for our newsletter. The next day, we send out an email blast, and that visitor clicks on a link in our message and finally buys something.
That may seem like a lot of touchpoints, but that’s actually a very simple example using only online channels. And one very important question is now a lot more difficult to answer: Who gets “credit” for that purchase?
Was it the original search ad that brought the customer to us in the first place? Or was it that email blast that finally got them to convert? Or was it the social media post that got them to sign up for that newsletter? Or was it our organic search engine optimization that allowed them to find us when they wanted to come back?
The truth is every one of these touchpoints deserves some credit, but how to allocate that credit becomes a bit tricky. And the surprising thing is that as you’ve been looking at all of your standard analytics reports in most every analytics tool, you’ve been using what’s called “last-click” attribution, meaning that the last touchpoint gets 100% of the credit.
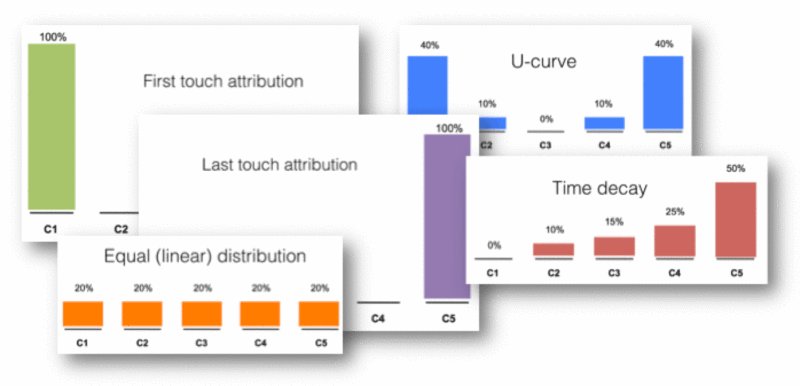
A few different attribution models
Most of the enterprise web analytics tools offer dedicated reports that help you to look at your marketing channels through different lenses, or attribution models, and while none are “right” or “wrong,” they can be extremely helpful in allocating marketing budgets and understanding the return on your digital advertising investments.
For example, you may have a display campaign running that’s aimed at branding and awareness goals. In a last-touch attribution model, this will look terrible since it’s aimed at the top of the marketing funnel: it’s not meant to drive a sale, it’s meant to get someone into the conversion journey.
So in this case, a first-touch model or a custom model that weights early interactions higher may make more sense to value this media. A retargeting campaign, on the other hand, might be meant to get someone who almost purchases to finally buy. Here, attributing more value later in the funnel makes a lot of sense.
There are a wide variety to tools and solutions to help with attribution ranging from the dedicated reports in your web analytics package to dedicated solutions fueled by sophisticated algorithms and data science that can help understand the value of even your offline channels. Either starting down the path of attribution or moving further down it is sure to pay dividends in 2015.
Get Moving
Whatever your 2015 resolutions, using more and more data and analytics in your organization will help bring you a very prosperous and happy new year.
Contributing authors are invited to create content for MarTech and are chosen for their expertise and contribution to the search community. Our contributors work under the oversight of the editorial staff and contributions are checked for quality and relevance to our readers. MarTech is owned by Semrush. Contributor was not asked to make any direct or indirect mentions of Semrush. The opinions they express are their own.
Related stories
About the author