3 “Hidden” Google Analytics Reports For Retailers
How can retailers get the most out of Google Analytics? Columnist David Rekuc describes three reports you may not be using yet that can help you uncover useful data.

There’s no doubt about it — Google Analytics is a powerful way to measure your site’s traffic and advertising ROI. But despite its utility, I’ve had many users tell me they fear they’re missing out on valuable insights simply because they don’t find the platform particularly intuitive.
In this article, I’m going to describe three “hidden” reports that I frequently use to uncover constructive data and show you how to build them for your own campaigns.
Evaluate The Customer Journey With Model Comparison
Multi-channel attribution is the holy grail for any analyst, or at least that’s what we’ve all been led to believe. In the simplest terms, multi-channel attribution across marketing channels is assigning a value to each touch point along the way to a conversion. But it’s easier said than done.
Most tracking and analytics software is set to attribute each conversion to the last click. However, in most cases, consumers aren’t responding to a single ad; they may be drawn in by one channel, persuaded by another, and ultimately converted by a third. (Very often retargeting appears to be more effective than traditional ads because they naturally skew toward the end of a customer’s journey.)
So, who gets the credit? Well, that question opens a massive can of worms.
The number of paths a customer could take to making a purchase — and the reasons he or she may take them — is virtually limitless. Instead of trying to solve an unsolvable riddle (or sinking my entire budget into chasing one metric), I focus on what introduces shoppers to my client’s site and what ultimately converts them. Enter the model comparison report in Google Analytics.
Head into the conversions tab in the reporting section of Google Analytics and select the model comparison report under attribution. Then select and compare first interaction versus last interaction.
Let’s take a look at how this report could impact AdWords campaigns. (Do this by changing the type from the default all to AdWords. It’s just above the main selection tool.) The settings for the report would look like this:
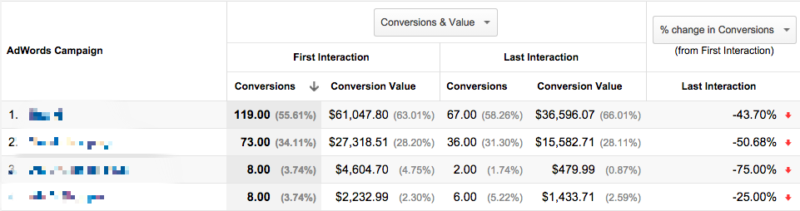
(For the record, I specifically chose campaigns that would highlight the value of this report. This image is using data from non-brand search and shopping campaigns, meaning they’re very often associated with product discovery but not necessarily conversions.)
Had we only paid attention to Google Analytics’ default reporting (which attributes conversion to last touch), we would have significantly undervalued the ability of non-brand search and shopping campaigns to introduce new visitors to our marketing funnel.
Here are a few ways to use this data:
- Find channels that are exceptional at driving sales using the first touch method. They’re probably under-credited for their ability to introduce new visitors to your site. Convince your boss or client that those dollars aren’t wasted ad spend using cold, hard facts. Bask in your marketing glory.
- Look for channels that drive more sales from the last touch than the first touch. These channels often get too much budget thrown at them simply because they’re cherry picking sales that have been built on the back of prior campaigns. Though I’m a huge fan of retargeting, it often gets over-attributed for its effectiveness. In the vast majority of cases, it’s not the first touch your customer has with your site or product.
Monitor Organic Search Using Landing Pages
In September 2013, to the great dismay of digital marketers everywhere, Google put the final nail in the coffin for organic search terms on Google Analytics.
Fortunately, there’s a workaround using the landing page report and an organic search filter that offers most of the same insights. You can find this report under the behavior tab in the reporting section of the suite.
I like to think of each organic landing page as a mini-campaign for two or three organic search keywords. This is a good way to comprehend the value derived from this custom report.
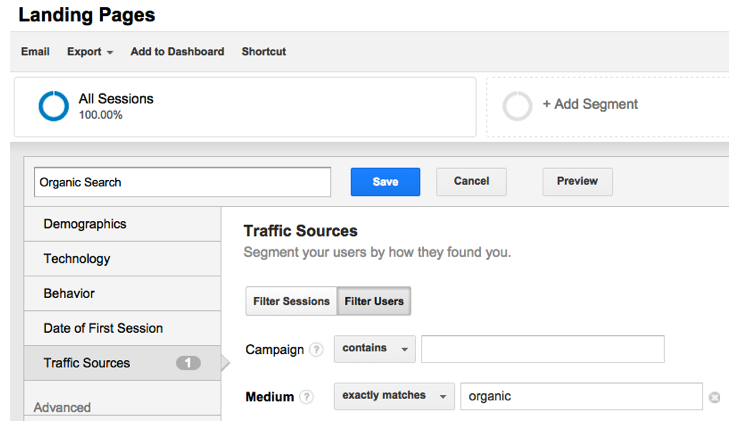
Once you’ve got the landing pages report pulled up (it’s under site content), click on the add segment button at the top of the page and start building a new segment. (It’s a very hard-to-miss red square.) Next, select the traffic sources tab and set the medium to organic. Take a look:
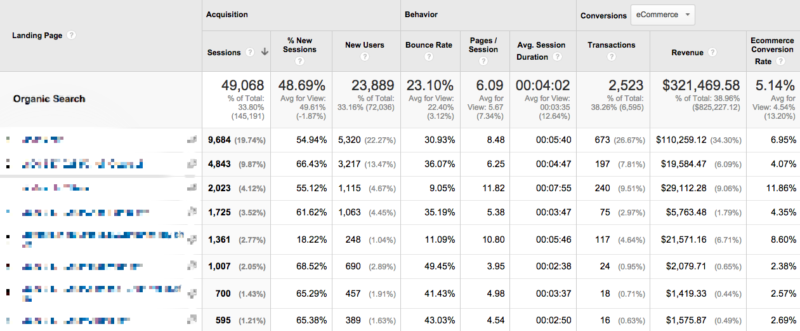
Name, save and apply this segment, and your landing page report is now filtered to only show traffic from organic search. Here’s what your report should look like:
And here are a few ways to use this data:
- Find landing pages that are converting well but have the potential to increase their ranking in organic search (or increase your search share by running paid search ads). You’ll have to compare this report with a ranking report from Google Webmaster Tools or another third party, and then determine your course of action when you find a page worth fighting for.
- Find landing pages that are seeing plenty of traffic, but suffer from a poor conversion rate. Sometimes a single product page winds up outranking a category page, or the product selection on a category page doesn’t line up with the search term. Whatever the case may be, investigate and tweak the page, or you’re leaving money on the table.
- Compare this to what your landing page report looks like for paid search to find obscured opportunities for either channel. (I go more in-depth on how SEO and paid search go hand-in-hand here.)
Choose Featured Products Based On Past Data
Today’s marketing folks have it good. We’ve got data for days; we know our ROI. Our ad space and cost are measured down to the penny. But how often are our digital merchandising decisions driven by actual campaign metrics?
The truth is, we’re constantly making merchandising decisions in digital marketing, and sometimes those decisions are completely arbitrary. What products are on your paid search landing pages? What products will get featured in your next email?
Provided you have your ecommerce settings enabled and properly configured, you should be able to see product sales and segment them on your analytics platform. They’re located under ecommerce in the conversions tab.
Start building your report by creating a new segment to filter your results. This report could be used to measure any marketing effort with a merchandising component, but I’ll focus on landing pages again as an example.
First, you’ll set the medium to organic like we did in the previous section of this article. Then, you’ll add a custom condition (under advanced) to filter by specific landing page:
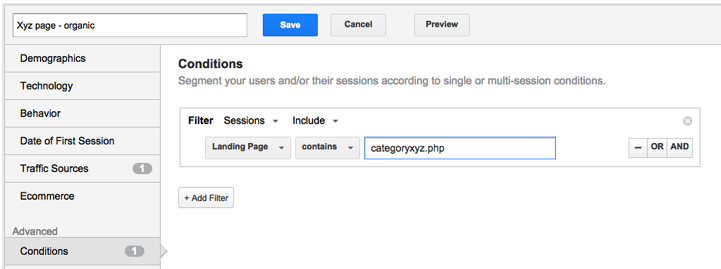
Once you’ve got your report built, you can review product sales based on that landing page for an organic search query. The results may surprise you. Take a look at one of mine:

Here are a few ways to use this data:
- Set up this report with a popular category page as the landing page. Do the sales line up with the products’ position in the category? Very often products are organized by what we think will sell, rather than what is actually selling.
- Look at this report for an email campaign instead of a landing page. Do you see the items you highlighted in the email selling? Were there any breakout sellers that weren’t featured or had low priority? Use this as the measuring stick for merchandising future marketing emails.
- Just to reiterate, I used a landing page as an example for this report, but you could tweak it so that almost anytime you make a merchandising decision, you’re relying on data to guide your choice.
Share The Wealth
These are three of my favorite hidden reports, but I’m positive there are many more useful configurations out there — some even I might not have thought of. If you’ve got a particularly creative or useful report to show off, please share the wealth. And as always, if you’re looking for help on any of the tips above, feel free to reach out to me in the comments.
Contributing authors are invited to create content for MarTech and are chosen for their expertise and contribution to the search community. Our contributors work under the oversight of the editorial staff and contributions are checked for quality and relevance to our readers. MarTech is owned by Semrush. Contributor was not asked to make any direct or indirect mentions of Semrush. The opinions they express are their own.
Related stories
About the author