3 Google Analytics 4 features to make up for lost data
Using these tools in GA4 will help compensate for tracking limitations so that you can remain data-informed.
Spy on Any Website
With the legacy version of Google Analytics retiring soon, we’ve entered the era of Google Analytics 4 (GA4). Aside from getting a major facelift and data model change, one of the platform’s most powerful upgrades was the addition and refinement of machine-learning capabilities.
Google Analytics now has the ability to combine observed data and unobserved data. Not only is this a benefit, but it’s a necessity as changes in browser cookies and user identifiers increasingly limit the old way of tracking.
Our tracking and analytics tools are losing data as we know it — and we must adapt. Using some easy features in GA will help compensate for this loss so that you can remain data-informed.
Dig deeper: 3 ‘secret’ marketing tools in Google Analytics 4
Unobserved data: How it works and why it matters
No matter which analytics tool you use, leveraging unobserved data is a great tool to keep up with the evolving environment of digital marketing analysis. The difference between unobserved and observed data is the difference between collected data and modeled data.
Tracking users with cookies used to be more reliable since almost all browsers accepted cookies. The way it functions with analytics is by automatically stamping a user with a cookie when they land on a website. This cookie allows platforms like GA to identify users by device information, location, demographics and, most importantly, a random ID that’s “sticky.”
When that user returns to the website, the ID is recognized by GA as a returning user, which stitches that user’s past information with new activity. For mobile apps, the behavior is similar. Instead of a cookie, devices have a unique advertising ID as an identifier (Android and iOS have different versions.)
However, things have been changing gradually over the past several years and will continue to change. There’s a huge problem with this old behavior: it gave users little to no control over their personal information being shared. Privacy wasn’t a consideration, and organizations had 100% control over their audience’s information.
No personally identifiable information (PII) was ever tracked with Google Analytics by default as collecting such data to GA is against the terms of service, but the definition of PII has changed depending on how policies are written and interpreted by different laws and security teams.
Now, users can block and opt out of analytics tools from collecting data. Automatic opt-out is the default for GDPR and other countries’ laws are certain to adopt this. It’s the “cookieless future.”
Long story short — we won’t get the volume or detail of user data we used to, so it’s time to fill that gap. In Google Analytics 4, there are several out-of-the-box features to make up for lost data. They require little to no lift once tracking has been set up, so you can test and take advantage of them today. Three examples are:
- Data-driven attribution
- Predictive metrics
- Behavior modeling
Dig deeper: What do marketing attribution and predictive analytics tools do?
1. Data-driven attribution
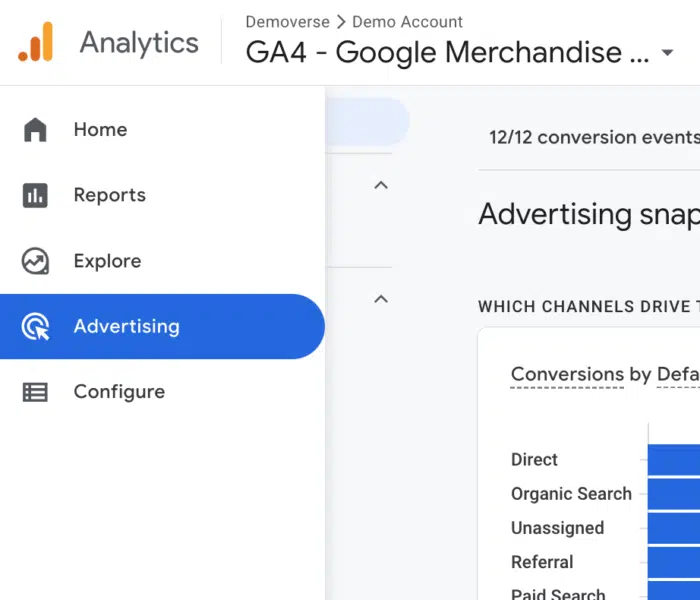
In GA4, data-driven attribution (DDA) may be somewhat hard to find if you’re not familiar with the interface. It’s located in the Advertising screen instead of the Reports area. The Advertising reports are interesting and split out because they provide a different view of your data.
In Universal Analytics (sometimes referred to as GA3), the closest equivalent is the Multi-Channel Funnel reports. It’s a good descriptor because these reports expand the analysis of conversions into multiple touchpoints and a fuller user journey. Previously, data-driven attribution was only available to paid 360 accounts but now it’s available to all.
The DDA attribution model uses a statistical model to show how significant a channel was in assisting a conversion. For example, there may be 5,000 purchases attributed to the Organic Search channel in the main GA4 acquisition reporting but the previous touchpoints from the Paid Search channel may be significantly influential to the user who ultimately purchases.
The statistical model will take the data about users’ behavior and paths leading up to the conversion and determine how much credit the different touchpoints should receive. Instead of 100% credit going to organic in the previous example, credit would be divided by percentages across all channels users came from before making a transaction.
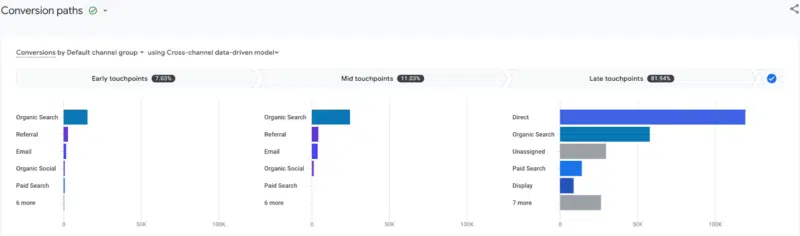
The visualization of DDA is located in the Advertising > Conversion Paths report (pictured above.)
Recommended Articles
2. Predictive metrics
We have data about what users saw and engaged with, but what will they do next? This is the ultimate example of unobserved data because it involves “future” behavior. As a note, this feature currently relates only to ecommerce and churning data.
Ecommerce tracking will need to be set up before predictive metrics and predictive audiences can be used. If you have ecommerce tracking, the top areas to see and use predictive modeling are in the Explore reports and the Audience tool.
In the Explore reports, predictive metrics are best used in the User Lifetime technique. In this report type, you can choose metrics to import based on purchase probability, churn probability and predicted revenue. There’s a section dedicated to those metrics on the selection screen.

The predictive data in GA4 (both here and in the Audience tool) is based on past user activity. With the data points of users who have made a purchase compared to those who haven’t, the model will learn trends that develop the probabilities and percentiles. For churn, the model looks at users who are active and users who become inactive to determine who won’t come back to your site or app in the next week.
The insights can be used outside of Google Analytics as well. Audiences and segments can be created to isolate likely/unlikely purchasers and used in Google Ads for remarketing. To build a predictive audience in a few clicks, you can go to Admin > Audiences > New Audience > Predictive. This will give you pre-made templated audiences to use and customize how you’d like (pictured below.)

3. Behavior modeling
Behavior modeling is the most impactful machine-learning feature out of these three because it affects user tracking right from the source — the identifier. It involves integrating GA4 with your cookie consent management tool so that Google Analytics can collect data on users who don’t consent to be tracked.
This sounds counter-intuitive, but the data is anonymized and not related to a cookie or any user identifier. Instead, the anonymous event-only data is used to determine user-level activity. It’s powerful because it’s based on your site or app’s data. The behavior of observed users (users who opt-in to tracking) trains a machine-learning model to estimate the behavior of users who opt out of tracking.
If you’re interested in taking advantage of behavior modeling, Google’s documentation on consent mode can help start conversations and action around using this user tracking method. The option to enable behavior modeling in your GA4 account is in Admin > Reporting Identity > Blended.

Making the most out of GA4’s machine-learning features
With the tools above, questions about your users and data can transform from “How many views did page X receive?” to “Which users are most likely to make a large purchase within the next 7 days?” This sophistication is much more actionable.
Combining GA4’s machine-learning methods with remarketing and audience-sharing can launch your analytics from solely analysis to immediate use cases and even audience engagement and RoAS impact.
Dig deeper into GA4 with these stories.
Contributing authors are invited to create content for MarTech and are chosen for their expertise and contribution to the martech community. Our contributors work under the oversight of the editorial staff and contributions are checked for quality and relevance to our readers. MarTech is owned by Semrush. Contributor was not asked to make any direct or indirect mentions of Semrush. The opinions they express are their own.
Samantha has been working with web analytics and implementation for over 10 years. She is a data advocate and consultant for companies ranging from small businesses to Fortune 100 corporations. As a trainer, she has led courses for over 1000 attendees over the past 6 years across the United States. Whether it's tag management, analytics strategy, data visualization, or coding, she loves the excitement of developing bespoke solutions across a vast variety of verticals.
View Author ProfileAdd us as a preferred source on Google
Google's "preferred sources" feature allows users to customize their search results by selecting news outlets they want to see more often in the "Top Stories" section.
Add Martech NowRelated Articles

Google Analytics just made it easier to see how much traffic AI assistants are sending to your website.
Read More
Direct traffic isn’t always intentional. In GA4, it often captures missing referrer data, untagged campaigns and AI-influenced visits.
Read More
Marketing artificial intelligence (AI)
9 minutes readSeeing a spike in direct traffic you can’t explain? It’s not a glitch. Here’s how to prove AI visibility is driving brand recall — even when you don't get the click.
Read More
Sessions don’t tell the full SEO story in AI search. Engagement metrics reveal whether content actually satisfies user intent.
Read MoreRelated Articles
Google Analytics just made it easier to see how much traffic AI assistants are sending to your website.
Read More
Direct traffic isn’t always intentional. In GA4, it often captures missing referrer data, untagged campaigns and AI-influenced visits.
Read More
Marketing artificial intelligence (AI)
9 minutes readSeeing a spike in direct traffic you can’t explain? It’s not a glitch. Here’s how to prove AI visibility is driving brand recall — even when you don't get the click.
Read More
Sessions don’t tell the full SEO story in AI search. Engagement metrics reveal whether content actually satisfies user intent.
Read More