This Quarter In Facebook: Engagement Rates Up As Costs Come Down
Facebook advertisers should leverage video and mobile, says columnist Andrew Waber, and he dives into Nanigans' data to show you why.

Confidently taking stock of the Facebook environment and appropriately rolling out tactics to best meet strategic goals is an ongoing challenge, even for large advertisers. New ad types debut, others are modified, targeting criteria are adjusted, and that’s on top of the platform itself growing more globally and its ads becoming ingrained in areas outside of Facebook.
To provide some guidance in this fluid marketplace, the team and I at Nanigans (my employer) release a wide-ranging Benchmark Report every quarter. The idea is to quantify metrics like click-through rate (CTR), cost per click (CPC) and cost per mille (CPM) across the entirety of Nanigans’ client base.
Each quarter’s sample comprises hundreds of millions of dollars in ad spend across hundreds of different brand advertisers. However, it’s worth noting that the vast majority of Nanigans’ customers are direct response advertisers at ecommerce, gaming and other internet and mobile-focused companies. So we are looking at a subset of the Facebook ad marketplace that, while large and varied, may not necessarily act as a proxy for the larger ecosystem.
That being said, these data do offer some visibility into how Facebook’s ad environment is evolving in a number of key areas.
The Changing Face Of Facebook’s Ad Environment
As ad engagement is a primary indicator of platform performance, let’s begin by examining global Facebook ad CTRs of Nanigans users over the past year:

Global Facebook ad CTR showed moderate growth in Q2 2015, maintaining the strong engagement rates observed previously. Average CTRs in Q2 were 0.88%, up 8% from Q1 2015, and up 187% from Q2 2014.
While the year-over-year growth rate is particularly striking, it’s nothing new. Global Facebook CTRs have maintained fairly steady growth rates nearly every quarter since Nanigans began conducting these reports back in mid-2013.
This trend is driven by a number of factors, including:
- The ongoing improvement of targeting options for advertisers
- The rollout of more immersive ad formats like video
- The increase in Facebook mobile activity — an area that historically demonstrates higher CTRs on Facebook as compared to desktop.
Those last two bullet points represent a pretty substantial shift in the Facebook advertising environment, just between the past two quarters:
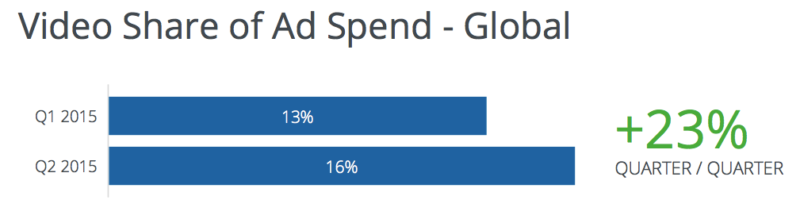
Video ads are currently commanding 16% of global Facebook advertising spend running through Nanigans software. While this may not seem dramatic on the surface, the fact that this has grown three percentage points, or 23% quarter-over-quarter, is noteworthy. Keep in mind that with an advertising market as large as Facebook, spend share shifting by a few percentage points in a matter of months indicates a significant change.
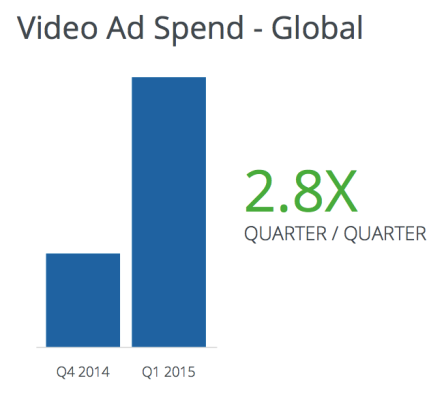
This swing in share comes on the back of a remarkable period of growth between Q4 2014 and Q1 2015, when raw video spending increased by 2.8 times:
Looking more closely at the most recent data set, it is clear that mobile has become the place where advertisers are willing to throw more of their weight behind the video format:
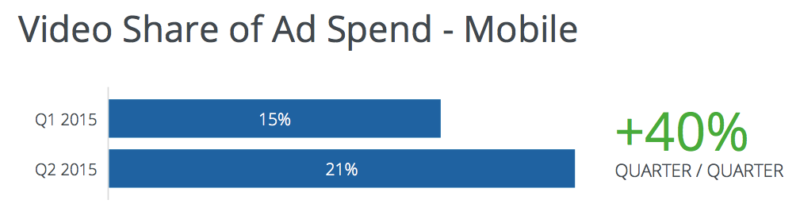
A full 21% of observed mobile Facebook ad spending was allocated to video ads. Representing an increase of 40% over the 15% share observed in the prior quarter, this growth directly relates to advertisers recognizing the efficacy and ROI potential of mobile, particularly when it comes to the video format.
In aggregate, video ads are driving higher CTRs than their static-image or link-focused counterparts, while demonstrating comparable CPCs. With this in mind, it’s easy to see why advertisers are putting two and two together to scale up and get a lot of value out of mobile video campaigns on Facebook.
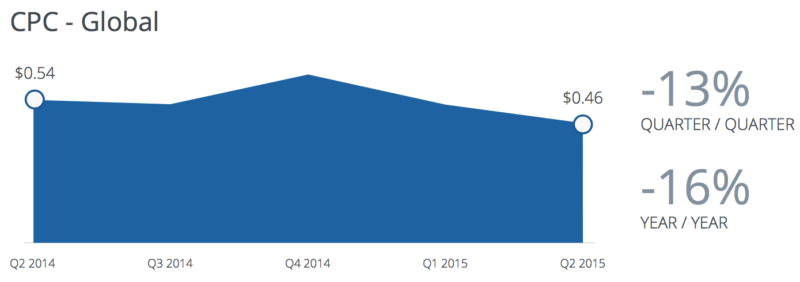
What will be worth looking out for in future quarters is how international growth affects spend allocation. Between the first and second quarter of this year, we observed Facebook ad spending growth in areas outside of the U.S. — markets which tend to be less expensive. This contributed at least partially to the overall CPC drop over the same period, from 53 cents in Q1 to 46 cents in Q2, the latter being the lowest global Facebook CPC observed since Q4 2013.
Of course, user behaviors and preferences can vary on a country-by-country and region-by-region basis. The question then becomes, what does this variance look like, and how dramatic is it? While we’ll be looking to quantify this issue later in the year. In the meantime, Facebook advertisers should take a look at how they may be able to presently leverage video and mobile.
Contributing authors are invited to create content for MarTech and are chosen for their expertise and contribution to the search community. Our contributors work under the oversight of the editorial staff and contributions are checked for quality and relevance to our readers. MarTech is owned by Semrush. Contributor was not asked to make any direct or indirect mentions of Semrush. The opinions they express are their own.
Related stories
About the author