Marketing Power Processes: Tracking Email To The Dollars
This is another article in a series I’m calling “Power Processes.” Power Processes not only make marketers better, they demonstrate their contribution to the bottom line visibly and measurably . Ignore Open Rates & Click-Through Rates If there is one theme in our Power Process series it is this: Measure results to the dollars. Open […]
This is another article in a series I’m calling “Power Processes.” Power Processes not only make marketers better, they demonstrate their contribution to the bottom line visibly and measurably .
Ignore Open Rates & Click-Through Rates
If there is one theme in our Power Process series it is this: Measure results to the dollars.
Open rates and click-through rates don’t give you the true performance of your emails. They also don’t let your team take credit for keeping the accountants busy.
We recently did an analysis of one of our ecommerce client’s email campaigns. They had been testing how the “disclaimer” line in their emails was affecting purchase behavior.
The “disclaimer” is the first line in an email. It typically says something like “Having trouble viewing this email? Click here.” The reason this line is important is that most email clients now show the subject line and the beginning of an email in the inbox view. Here’s an example from my Gmail promotions folder.
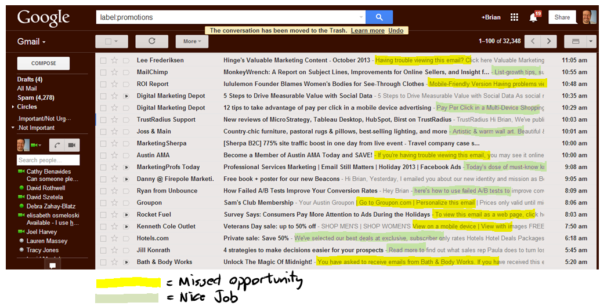
The first line of your email is as important as the subject line.
One assumes that, if these messages are working, they will be reflected in a better open rate. It turns out not to be true.
So, we tested different versions of this text over the course of 23 emails. The Open Rate predicted which would generate the most revenue in less than half of them.
As a predictor of revenue, click-through rate didn’t fare much better, calling the revenue winner in thirteen of the tests.
Revenue-Per-Recipient Puts Marketing In The Money
When we talk about monetizing a list, the metric we like is Revenue-per-Recipient.
It is calculated as:

It tells us how much spendable revenue we’re getting from each member of our list. To look at it another way, it’s an estimate of the value of each person on our list.
With proper analytics, we can measure this for the whole list, particular segments of the list (customers vs. new subscribers for instance), or for different treatments in a split test.
Measuring it requires some discipline and a bit of analytics work.
Getting To Revenue-Per-Recipient
The key to getting the Revenue-per-Recipient (RPR) number is tying email clicks to transactions. This may require some help from your friendly IT department.
Configure Your Analytics Package
Most ecommerce companies will be pumping the results of each transaction into their analytics software. If you’re generating leads for your business, your analytics system can track new prospects for you as well.
We talked last time about tracking phone calls generated by your site. Done right, you can track the number of calls made by email clickers.
Do the work necessary to get reliable reporting of sales or leads into your analytics package. Once this is done, you have what you need to calculate the impact of email on the bottom line.
Mark Your Email Traffic
This is where the discipline comes in. We need to be able to identify the traffic generated from each email drop. This is done typically by adding special parameters to the links in the emails that come back to our site.
What you add to you add to your URLs depends on your analytics package. Google Analytics has a set of standard parameters. An email link, properly tagged might change from:
http://buyschtuff.com/halloween
to
http://buyschtuff.com/halloween?utm_campaign=halloween-special&utm_source=subscriber-list&utm_medium=email
When someone clicks on this link, Google Analytics will know that it was from the email talking about the Halloween Special, that it was sent to the Subscriber List, and that it was clicked from an email.
I have found that it’s important to add the date of the email drop as well, and this can be added to the campaign description. Here’s the format I use.
http://buyschtuff.com/halloween?utm_campaign=halloween-special-20131029&utm_source=subscriber-list&utm_medium=email
Many email service providers offer integrations with popular analytics packages, such as Google Analytics. They will add these tags automatically for you. The only down side is that the campaign names they choose may not be as easy to read. Mailchimp sends Google Analytics campaign names like “934f31ce51-Webinar_Follow_up_Email_10_31_2013.”
Readability is important.
We will want to be able to identify performance of individual emails when we’re testing or sending to specific segments. We will soon want to be able to marry our email service provider reports with our analytics reports. Readability will be key.
Power Reports
This process gives us the ability to see the revenue each email produces directly. Here’s a report taken from Google Analytics.
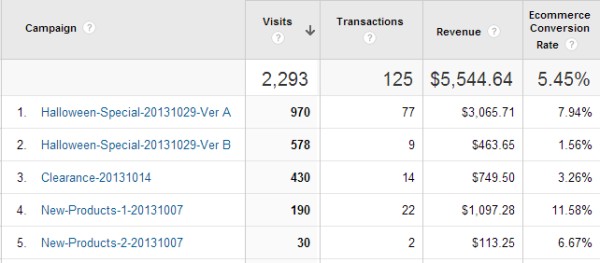
Track your emails to the dollars.
For any of the emails in this kind of report, we can pull the number of recipients from our email service provider. This gives us our Revenue per Recipient for each drop and an overall number.

Revenue per Recipient accounts for list size and revenue generated.
In this example, we got 37 cents for each member of our list. However, we can see that this number is skewed by the first one, delivering a whopping $1.20 per recipient.
Don’t be concerned that 37 cents sounds so small. RPR numbers are rarely exciting in their magnitude.
A Word For B2B Lead Generators
It may not seem that this will work for lead generators, especially those with long sales cycles. Nonsense.
As lead generators, we should know the value of a lead to our business. For our purposes, how we calculate it is less important than being consistent. Lead value is calculated by New Customer Revenue/New Leads.
We could calculate it once based on last year’s numbers and use it for all emails until you calculate it again.
We could calculate it every month by dividing the past month’s new revenue with all new leads from the past three months.
You should choose the method that you can justify, and that delivers a consistent RPR month over month.
Power Process Tip: If you can calculate the true value of a lead for your organization, you can calculate your value as a lead generator in terms everyone understands: dollars.
Optimizing Revenue-Per-Recipient
There are two ways to increase your Revenue per Recipient, both of which are best practices in email marketing.
- Increase the revenue your list is generating. Duh.
- Decrease the number of recipients. What?
Like trees in the winter, it’s important to prune and shape your list. Those who have never opened a single one of your emails should be dropped. In fact, many email marketers drop non-openers every 90 days or less.
It’s scary, but it’s good business.
Of course, we all want our lists to deliver steady revenue growth. This comes from understanding the offers, subject lines, email copy and landing pages that make the most money for the business.
It’s relatively easy to test emails. Just remember to test to the dollars using RPR.
A Final Word About Accuracy
This method doesn’t take into account the revenue generated when your emails create non-click demand. You don’t get credit when recipients see your email, but call, come to your store, or visit your site through other means. Nonetheless, RPR this is a valid measure of the dollar impact we are having on our businesses.
It’s time to stop boring people with how good your open rates and click-through rates are. Tell them what each and every person on your list is worth in dollars. When you track the results of your emails down to the dollar, you track your own value down to the dollar.
Contributing authors are invited to create content for MarTech and are chosen for their expertise and contribution to the search community. Our contributors work under the oversight of the editorial staff and contributions are checked for quality and relevance to our readers. MarTech is owned by Semrush. Contributor was not asked to make any direct or indirect mentions of Semrush. The opinions they express are their own.
Related stories
About the author