Behavior Flow: Better Insights, Better Marketing
While there are thousands of different pieces of data available in Google Analytics, unfortunately there aren’t thousands of hours in each month for us to slice and dice this data into something useful. Our time limits mean actionable data need to be right at our fingertips — not always easy with a program that grows […]
Spy on Any Website
While there are thousands of different pieces of data available in Google Analytics, unfortunately there aren’t thousands of hours in each month for us to slice and dice this data into something useful. Our time limits mean actionable data need to be right at our fingertips — not always easy with a program that grows more robust as time passes.
So how do we solve the problems we face? Is traffic not engaging with your website? Are particular channels not impressed with what you’re offering? Do you even know how to tell if those channels are performing well?
Help is here! Behavior Flow was a previously buried, and fairly difficult to navigate, section of Google Analytics that created a pretty chart, with lots of colors and squiggly lines, but not much readily-available, actionable content. This has changed significantly in the recent past — and it is now quite easy to address the behavior of certain segments of visitors and their behavior on your website.
It’s time to stop blaming the channel and start adjusting your content to meet the wants and needs of that channel. Here’s a scenario:
A client is not very happy with the performance of their Pinterest traffic. It seems that nearly every Pinterest visitor drops off after viewing one page (high bounce rate.) The question then surfaces: what can we do to improve this? Of course, A/B Testing is a key component; but before you can test, you have to find out what pages are really causing the issues.
Using the Behavioral Flow Report, we can isolate pages, or sources, or even keywords, and analyze how visitors behave once they land on our website. We can then follow the path a successful visit takes and try to isolate why that visit was successful when others were not. You can use RegEx to pick out sections of your website, groups of products, and more.
To configure the report, first choose “Behavior” and then “Behavior Flow” from the sidebar in Google Analytics.

Once you have navigated to the Behavior Flow report, you must decide what type of traffic you want to segment. I’ll show an example of segmentation based on Source here.
First, click on the drop down menu at the top of the Behavior Flow report. Type in “Source” and choose the item from the drop down menu. You can see there are quite a few options here.

Once you choose “Source,” you’ll see all of your traffic sources come up on the flow diagram. If you want to isolate one source, click on the box and you’re given 3 options. You can highlight all traffic that flows through that source, only the traffic that originates at that segment, and Group Details.
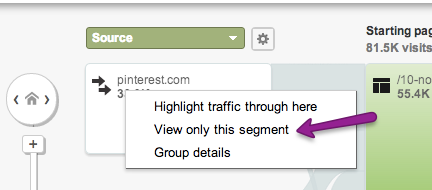
Group Details lets you include all of the URLs that have been touched by visitors who came to the site from your indicated source. I prefer to keep things focused and choose “view only this segment.”
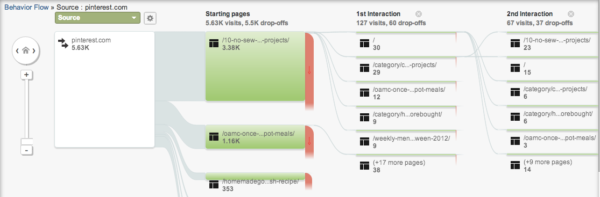
Now we can see the starting or (landing) page as well as the first and second set of pages that visitors interacted with. The “10-no-sew” page had a huge drop off — so that is obviously a problem. Traffic from Pinterest does tend to bounce a lot — but there are some tactics we can employ to get visitors to look at other pages.
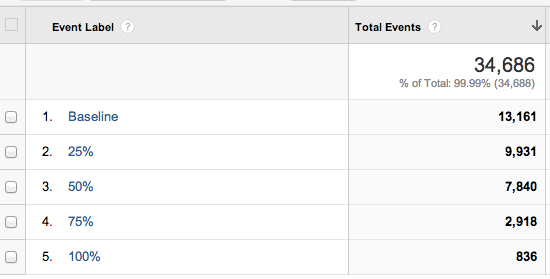
By combining scroll depth tracking with behavior flow, we can see where on a page the visitor is abandoning the content and place hooks above those points — within the content or within the sidebars — that encourages the visitor to review related posts. For our 10-no-sew post we know the following: 98%+ of traffic abandons the site (bounces) after viewing this page.

We also know that a majority of the traffic never goes below 25% down the page:
Using this information from scroll depth and behavior flow, we can then brainstorm some tactics to keep visitors interested in the page. This is my hobby site, so it always has a lot of work on the “to do” list. Here are a few things I might try:
-
Most “related posts” plugins show those posts at the bottom of the page, but would moving them into the sidebar, or into a block in the middle of the content, encourage users to stay on your site and view another page? If this is your goal, creating an A/B test could answer that question for you.
-
Can adding a contextual link to further reading within the content solve the issue easily and still preserve the flow of the article?
-
You could find out, using scroll depth, at what point on the page most content is abandoned and set up a popup that points to related content. Popups can be tricky and not so user friendly — so make sure you’re doing this for the right reasons and not just to inflate visitor counts.
There are a nearly infinite number of ways you can slice and dice data in Google Analytics. Behavior flow gives a nice visualization that can be used to show clients or coworkers where the content is failing and where the message needs to be changed.
Contributing authors are invited to create content for MarTech and are chosen for their expertise and contribution to the martech community. Our contributors work under the oversight of the editorial staff and contributions are checked for quality and relevance to our readers. MarTech is owned by Semrush. Contributor was not asked to make any direct or indirect mentions of Semrush. The opinions they express are their own.
Carrie Hill is the co-founder of Ignitor Digital, along with long-time colleague Mary Bowling. At Ignitor, Carrie tackles tough technical SEO roadblocks many small business owners don't even know they have. Her experience with analytics and troubleshooting helps her get to the root of issues. When not working, Carrie loves to cook for friends and family, hang out with her pretty awesome kids, and read books that have little-to-no educational value!
View Author ProfileAdd us as a preferred source on Google
Google's "preferred sources" feature allows users to customize their search results by selecting news outlets they want to see more often in the "Top Stories" section.
Add Martech NowRelated Articles

What looks unified in CreativeOps can hide layered dependencies that affect cost, control and performance as your operation scales.
Read More
A rumored MCP server would let marketers run campaigns in Marketo using simple prompts instead of manual workflows
Read More
Traditional metrics miss how decisions are actually made. Learn which signals reflect real influence before users ever click.
Read More
Technology is the biggest barrier to alignment, and most teams admit their stack still isn’t built to support shared goals or seamless execution.
Read MoreRelated Articles
What looks unified in CreativeOps can hide layered dependencies that affect cost, control and performance as your operation scales.
Read More
A rumored MCP server would let marketers run campaigns in Marketo using simple prompts instead of manual workflows
Read More
Traditional metrics miss how decisions are actually made. Learn which signals reflect real influence before users ever click.
Read More
Technology is the biggest barrier to alignment, and most teams admit their stack still isn’t built to support shared goals or seamless execution.
Read More