What Affects Ad Viewability? 5 Factors From A Google Study
As more advertisers move toward buying display ads on a viewable impression basis rather than by served impression, Google looked across its display ad platforms, including DoubleClick, to find out what affects an ad’s viewability. A viewable impression occurs when at least 50 percent of an ad in view for more than one second, according […]
As more advertisers move toward buying display ads on a viewable impression basis rather than by served impression, Google looked across its display ad platforms, including DoubleClick, to find out what affects an ad’s viewability.
A viewable impression occurs when at least 50 percent of an ad in view for more than one second, according to the IAB standard. Google’s study looked at display ads across web browsers on desktop and mobile devices and came away with 5 key findings.
1. Viewability averages are being dragged down by a an outsized number of publishers. The study found that 56.1 percent of display ad impressions were never viewable. However, the average publisher viewability rate was 50.2 percent.
2. Top of the page isn’t as important as you might think. Turns out the most viewable ad position is right above the fold, not the top of the page. That’s true for 300 x 250, 728 x90 and 320 x 50 ad units.
3. Viewability rates above the fold are higher than below the fold, but nowhere near 100 percent. Most likely the result of fast scrolling, 68 percent of above-the-fold ads were deemed viewable. Meanwhile, there is activity below the fold: forty percent of below-the-fold ads were viewable.
4. Ad size impacts viewability as well. It’s not surprising when you think about it, but vertical ad units are the most viewable as they stay on screen longer as users navigate the page. The 120 x 240 unit had the highest viewability at 55.6 percent, while the ever popular 300 x 250 had the lowest rate of viewability at 41.0 percent.
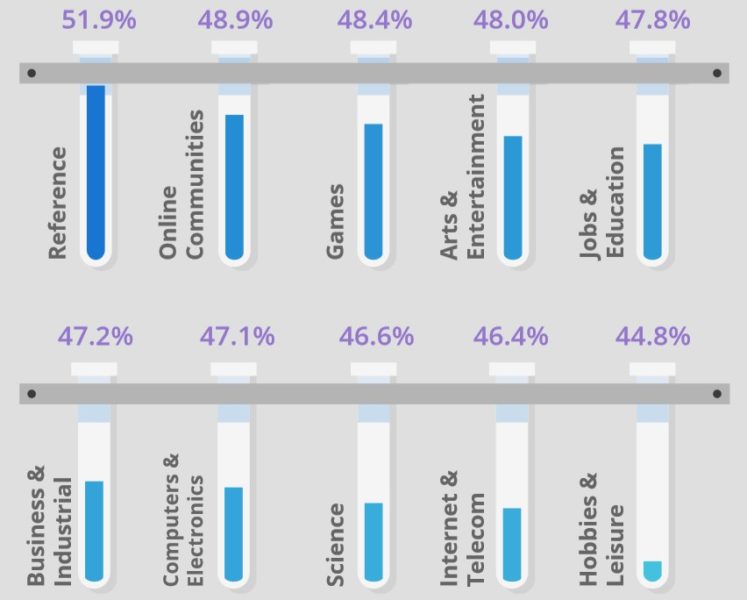
5. Interestingly, not all publishing verticals are alike when it comes to viewability. The chart below shows how each vertical stacked up. Reference scored highest in viewability at 51.9 percent, while hobbies and leisure scored lowest at 44.8 percent on average.
Contributing authors are invited to create content for MarTech and are chosen for their expertise and contribution to the martech community. Our contributors work under the oversight of the editorial staff and contributions are checked for quality and relevance to our readers. MarTech is owned by Semrush. Contributor was not asked to make any direct or indirect mentions of Semrush. The opinions they express are their own.
Related stories
About the author