Improve Your Marketing ROI Predictions With These 3 Considerations
While the industry is gradually getting savvier in general, lots of online marketers still base their budget and bid decisions on short-term returns using basic if/then statements across their paid search, social, and display ads programs. In a nutshell: if the short-term return on ad spend (ROAS) is low for a given social, display or […]
Spy on Any Website

While the industry is gradually getting savvier in general, lots of online marketers still base their budget and bid decisions on short-term returns using basic if/then statements across their paid search, social, and display ads programs.
In a nutshell: if the short-term return on ad spend (ROAS) is low for a given social, display or paid search audience, then one tends to decrease the bid and/or budget; conversely, if ROAS is high, then one would tend to increase the bid and budget.
This approach has one advantage: it is intuitive. However, in most cases, the reality is way more complex and requires one to take additional steps in order to make more informed — and not necessarily intuitive — decisions. Just to name a few:
- Short-Term Revenue (immediately tracked revenue) should be translated into lifetime long-term revenue in order to measure the true end return of any marketing effort.
- Predicted Marginal ROAS should be understood (aka portfolio logic) vs. a reactive rule-based approach, in order to best allocate budgets and adjust bids based on the cost of an additional conversion, as opposed to the average cost per conversion.
- Tracking Cost Of Goods (COGS) allows to switch from revenue to gross margin maximization and push categories with greater gross margin.
In this post I’ll attempt to touch on those three topics… while keeping it concise and visual.
1. How Is Lifetime Revenue Structured?
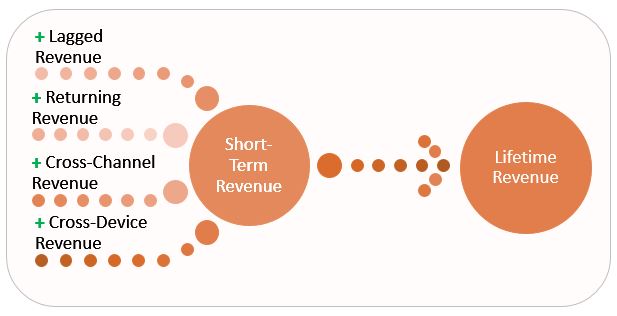
First of all, there is no good online marketing investment without a good understanding of how marketing revenue is structured. The short-term revenue you’re seeing in your dashboard (for the last couple of days) is most likely just a fairly small chunk of the true long-term revenue one can expect. In other terms, there are lots of revenue layers you should add on top of the short-term revenue, including:
Lagged Revenue. This is the revenue coming from past impressions and/or clicks which haven’t converted yet. For instance, if the average lag from impression to conversion is 25 days (with 50% before day 25 and 50% after day 25, for the sake of the argument), then you can only expect to see 50% of the revenue 25 days after launching your campaign.
Returning Revenue. This is the amount of expected revenue from returning users after the first conversion, aka lifetime value or LTV. If you know that your users make 2.1 conversions a year on average, then you can layer this in as well and predict for future revenue from multiple conversions, though you also need to consider what credit to give future advertising. Distinguishing new vs. returning users helps mitigate this issue — you can predict more future revenue for new users.
Cross-Channel Revenue. This is the revenue you are either not seeing online at all (in-store revenue, for instance), or the revenue going to other online channels (social to paid search, for example, in which case the revenue gets transferred from paid search to social). This topic is so broad that it can certainly not be summed up in such a basic bullet point; but, long story short, you should definitely account for expected cross-channel revenue on top of your short-term revenue.
Cross-Device Revenue. This is the revenue you are not seeing because of cross-device behaviors, a typical example being users clicking on a mobile ad then converting from their desktop. Note that in AdWords, there is a column called “total estimated conversions” which is supposed to help tackle this issue.
2. From Average To Marginal Return On Ad Spend Optimization
Now that you are not only looking into short-term revenue but also anticipating lifetime revenue, you can start considering different optimization logic with regards to budget allocation and bid optimization.
Like I mentioned earlier, the common approach would be to use some basic if/then statements — which is intuitive, but suboptimal. Consider the following media mix:

Intuitively, just looking at the short-term and lifetime ROAS by channel, it seems quite obvious one should invest more in paid search (ROAS=4.41), less in display (ROAS=2.94), and even less in social advertising (ROAS=2.31). Is it the right thing to do? How much should I reallocate, and what would be the expected returns?
To answer these questions, we don’t have a choice but to look into the marginal ROAS (as opposed to the average ROAS), i.e., the true cost of any incremental revenue for each channel. Now consider the (fairly massive) following table, which indicates the expected revenue levels at different spend levels across social, paid search, and display:
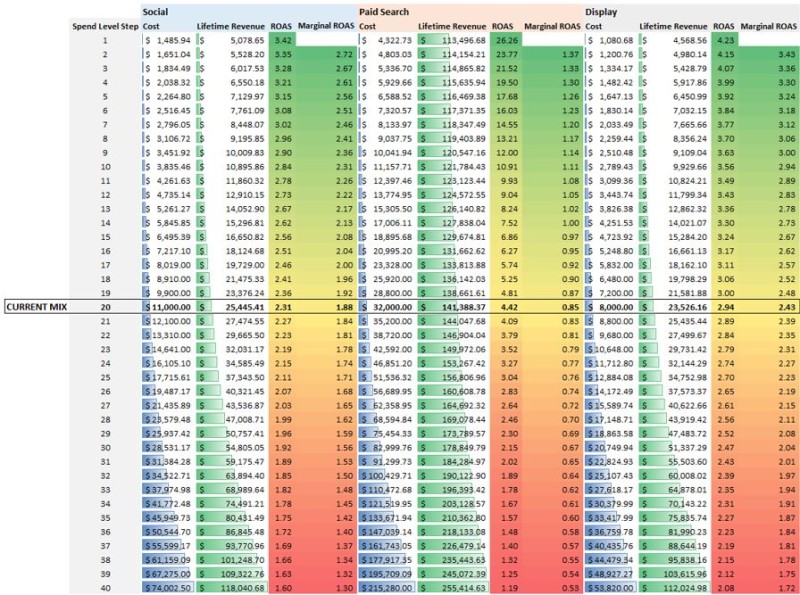
While the average ROAS for paid search is the highest (4.42), it has the lowest marginal ROAS, most likely because the ad spend has been maxed out across efficient keywords, and any incremental growth would come from inefficient terms, which is a typical observation.
In this case, you’d actually want to re-allocate your budgets so your marginal ROAS per channel are equal across all channels. Essentially the average ROAS numbers mask the reality of your marketing costs, and you want to level off the marginal cost per unit across all channels. Note that a similar approach can be applied across all keywords for paid search, all product targets for shopping, all audience targets for social, etc.
Getting back to our example, we could reallocate so that overall cost would decrease by 4.4% while revenue increases by 12.8%. Average ROAS would increase from 3.73 up to 4.41, which is not usual when applying this logic.
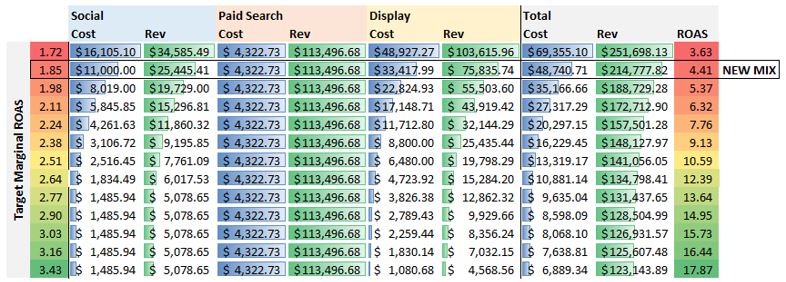
Long story short, a portfolio approach not only helps you get a sense of where to reallocate but also how much you should reallocate, since you can predict the outcomes cost- and revenue-wise — which is what any online marketer wants.
Recommended Articles
3. Switching Over To Gross Margin Maximization
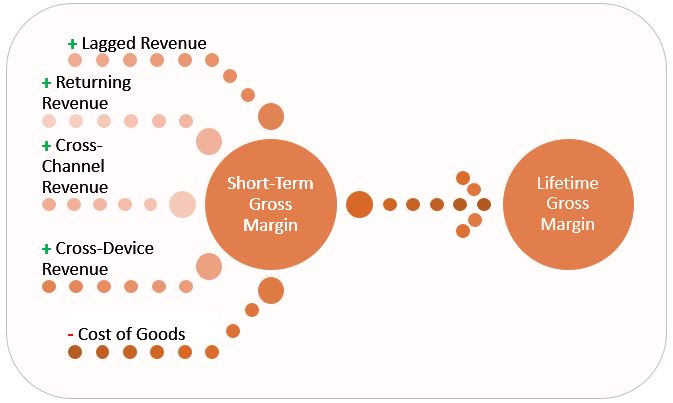
To clarify, gross margin (GM) as defined here is the revenue minus the cost of goods sold (COGS), as opposed to the revenue minus the ad spend. This implies tracking the COGS in a very granular way: keyword, product target, audience level, etc.
You can generally do this via FTP or directly from an online tag — we can track the COGS via Adobe Analytics, for instance. Another benefit of switching over from revenue to GM optimization is that different product categories have different cost of goods levels, which means the GM numbers will help you identify opportunities which you would not otherwise see if focusing on revenue.
For instance, you could have two product categories with similar ROAS levels; however, the true returns will be higher in the one category with the lowest COGS. Other than that, you can think of lifetime gross margin the following way, where we’re breaking things down the same way as before, except that we’re subtracting the cost of goods.
Conclusion
- Short-term revenue is dead! One should consider lifetime revenue instead — that is, the longer effects involved across channels and devices — and anticipate those.
- Average ROAS and CPA are dead! One should look into marginal ROAS and CPA instead.
- Also, bonus point for whoever can use more advanced indicators such as the cost of goods, and more generally any metrics closer to the true business value, which once again brings up the importance of sophisticated tracking.
Contributing authors are invited to create content for MarTech and are chosen for their expertise and contribution to the martech community. Our contributors work under the oversight of the editorial staff and contributions are checked for quality and relevance to our readers. MarTech is owned by Semrush. Contributor was not asked to make any direct or indirect mentions of Semrush. The opinions they express are their own.
Benjamin Vigneron is a seasoned digital marketing strategist with experience in Europe and the US and was listed as one of the best eCommerce PPC Experts by PPC Hero in September 2014. He currently works as a Senior Business Analyst in the Digital Marketing team at Adobe, where he provides advertisers and account management teams with data-driven and actionable insights on strategies to optimize their search, programmatic, and social initiatives.
View Author ProfileAdd us as a preferred source on Google
Google's "preferred sources" feature allows users to customize their search results by selecting news outlets they want to see more often in the "Top Stories" section.
Add Martech NowRelated Articles

The March updates focus on giving teams more flexibility, more precise control over automation and timing.
Read More
New data shows buyers jumping between watching, browsing, and buying, forcing marketers to rethink rigid funnel models.
Read More
New data shows martech replacement rates are dropping fast, signaling a shift from constant churn to a more cautious, efficiency-driven approach.
Read More
Long sales cycles, weak attribution, and underused fundamentals are holding B2B teams back. Here’s where data breaks down.
Read MoreRelated Articles
The March updates focus on giving teams more flexibility, more precise control over automation and timing.
Read More
New data shows buyers jumping between watching, browsing, and buying, forcing marketers to rethink rigid funnel models.
Read More
New data shows martech replacement rates are dropping fast, signaling a shift from constant churn to a more cautious, efficiency-driven approach.
Read More
Long sales cycles, weak attribution, and underused fundamentals are holding B2B teams back. Here’s where data breaks down.
Read More