The Email Metric You Should Be Tracking, But Aren’t
Most marketers rely on a few standard metrics to evaluate the effectiveness of their company’s email campaigns: deliverability, open rate, click-through, conversion, and unsubscribe are the favorite few. But there is one key metric that many are overlooking, one that many Email Service Providers don’t even display: Click-to-open rate, often abbreviated CTOR. CTOR measures the […]
Spy on Any Website
Most marketers rely on a few standard metrics to evaluate the effectiveness of their company’s email campaigns: deliverability, open rate, click-through, conversion, and unsubscribe are the favorite few. But there is one key metric that many are overlooking, one that many Email Service Providers don’t even display: Click-to-open rate, often abbreviated CTOR.
CTOR measures the relevancy and context of an email by taking the number of unique clicks divided by the number of unique opens, and then multiplying by 100 to show it as a percentage. What it tells you is simply this: Of the subscribers who opened the email, how many clicked.
CTOR May Be The Most Telling Measurement Of Content
Current email best practice is to create campaigns that are optimized for images blocked. This is achieved with an email including a healthy mix of HTML text and images. However, a large number of retailers still create and send email campaigns that are almost entirely image based (aside from minimal pre-header and footer text links). In these particular cases, the CTOR metric is critical in evaluating the content, offer and creative of the email, especially when an A/B test may have been performed on the campaign. Why? Because open rates can vary. CTOR stands as a more telling and useful measurement of the content and creative.
There is a lot of inconsistency in the calculation of email metrics (though the Email Experience Council has been working to establish new industry standards), and some analysts argue that CTOR is an ineffective measurement. This argument stems from the fact that the denominator — unique opens — is somewhat flawed due to the fact that an open is recorded when images are downloaded. This leaves an unknown number of subscribers who opened the email but didn’t download images, not to mention those who clicked-through the email without downloading images (an implicit open), unaccounted for in the metric’s calculation.
No Metric Is Perfect
As email continues to evolve as a tool, we will continue to work to bring ever more exacting measures to market. Even as sophisticated as measurements are at this point, a metric as straightforward and trusted as open rate is still not entirely accurate and standardized. Still, it is a universal metric for evaluating the success of email campaigns. Even if CTOR is not perfect, it’s better than only tracking opens or click-through because it gives context to your measurement by helping you understand a recipient’s engagement, and it can help guide your content decisions, to boot. As for criticisms, as long as CTOR is reported in a consistent manner, you’ll still be comparing apples-to-apples when evaluating your metrics over time.
Marketers commonly watch click-through rate (CTR), which in most cases will track proportionally to CTOR’s ups and downs:
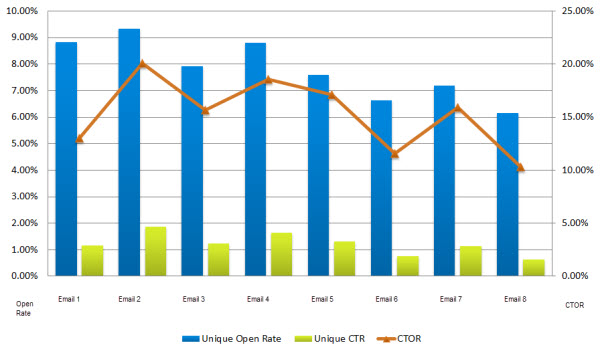
From this chart, it is clear that CTOR trends in-line with click-through rate. At a high level, a marketer may deduce that Emails 2, 4 and 5 created the highest level of engagement with subscribers, and that Emails 1, 6 and 8 had content and creative that was least favorable or relevant to subscribers.
Still, if you ignore CTOR because of its commonality to trend with click-through rate, you can miss something important:
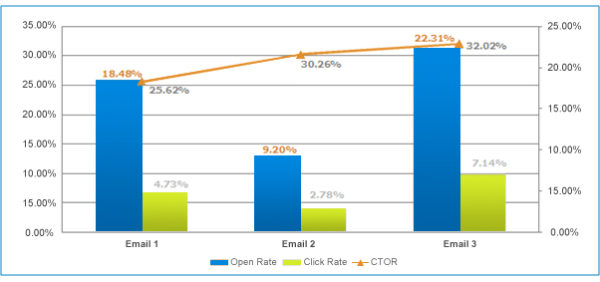
In this example (showcasing different campaigns from the first chart), you can see, based on the CTOR, the content and creative of Emails 2 and 3 outperformed the content and creative in Email 1, even though Email 1 had a higher click-through rate. Further research showed that Email 2 was sent to a larger list that also included unengaged subscribers, causing a drop in opens and click-through. By tracking CTOR, you have a clear demonstration that the content and creative resonated with those subscribers that did open and click. By only looking at open and click-through, you might have missed that opportunity.
Recommended Articles


Set Benchmarks For Different Types of Emails
The obvious question is, “What is a good click-to-open rate?” As with any benchmark, this depends on many variables including industry, type of email, segmentation, number of links in an email, etc. Depending on these variables, a good CTOR can vary from 20% to 30% for promotional campaigns, and 30% to 40% or higher for triggered campaigns. A better guide is to self-benchmark CTOR per campaign type over time. For example, establish the CTOR for newsletters, triggered campaigns, promotional campaigns, transactional emails, for each email in a series, and so on. By identifying the best and worst performing campaigns (as judged by a suite of metrics), a marketer can determine their company’s acceptable range for CTOR over time, and set goals for improvement through content and creative optimizations.
Finally, when evaluating campaigns on a weekly, monthly, and annual basis, consider this metric as one of many. A single metric does not tell the entire story. Even when evaluating what appears to be a low CTOR it is worth investigating further. For example, when reviewing the content and creative of the campaign, you might see the email with a poor performing click-to-open rate did not include enough links, or possibly the clickable areas were unclear to the subscribers, causing the low level of engagement. Deliverability, open rate, click-through rate, CTOR, conversion rate, and unsubscribe rate are all different views of the big picture, and should join total revenue, number of transactions, average order value (AOV), return on investment (ROI) and revenue per email (RPE) as go-to indicators of performance.
Additional resources:
Email Glossary, By the Email Experience Council
Email Campaign Performance Metrics Definitions, By the Interactive Advertising Bureau
Contributing authors are invited to create content for MarTech and are chosen for their expertise and contribution to the martech community. Our contributors work under the oversight of the editorial staff and contributions are checked for quality and relevance to our readers. MarTech is owned by Semrush. Contributor was not asked to make any direct or indirect mentions of Semrush. The opinions they express are their own.
Cara Olson is Director of Digital Direct/eCRM at DEG, a full-service digital consultancy based in Kansas City. Leveraging her 14 years of experience and thought leadership in digital direct marketing, she and her team lead email and SMS strategy, integrations, and campaign execution for flagship brands like Crocs, Helzberg Diamonds, MathWorks, Cabela's, Life is Good, and TITLE Boxing. In her spare time she runs half marathons, cheers on her beloved Royals, and drinks copious amounts of coffee while trying to exhaust her eight year-old daughter, five year-old boy, and one year-old golden retriever.
View Author ProfileAdd us as a preferred source on Google
Google's "preferred sources" feature allows users to customize their search results by selecting news outlets they want to see more often in the "Top Stories" section.
Add Martech NowRelated Articles

More tools, more channels, and more data have left many marketers struggling to connect activity to outcomes.
Read More
Campaign-based execution created disconnected teams, tools, and data. AI is enabling a more unified operating model.
Read More
From sales alignment to customer retention, a clear brand strategy helps companies grow faster and compete more effectively.
Read More
Automation can increase output, but creative effectiveness depends on operational discipline and strategic clarity.
Read MoreRelated Articles
More tools, more channels, and more data have left many marketers struggling to connect activity to outcomes.
Read More
Campaign-based execution created disconnected teams, tools, and data. AI is enabling a more unified operating model.
Read More
From sales alignment to customer retention, a clear brand strategy helps companies grow faster and compete more effectively.
Read More
Automation can increase output, but creative effectiveness depends on operational discipline and strategic clarity.
Read More