Tablets Vs. Smartphones: Online Engagement Patterns Present Opportunities
Two of the overarching goals for online marketers are maximizing the reach of their campaigns and increasing engagement levels. While delivering on the reach portion of this equation can be achieved through a number of well-known tactics, increasing campaign engagement is a much more nuanced task. The optimum content and delivery method of a campaign […]
Two of the overarching goals for online marketers are maximizing the reach of their campaigns and increasing engagement levels.
While delivering on the reach portion of this equation can be achieved through a number of well-known tactics, increasing campaign engagement is a much more nuanced task.
The optimum content and delivery method of a campaign will vary from industry to industry — and with consumers browsing across multiple device types, context (and how that impacts engagement on a larger scale) needs to be taken into account.
In this article, we examine a month’s worth of North American usage data to help quantify these differences, examining both major mobile device types — smartphones and tablets — and how user engagement rates vary by hour.
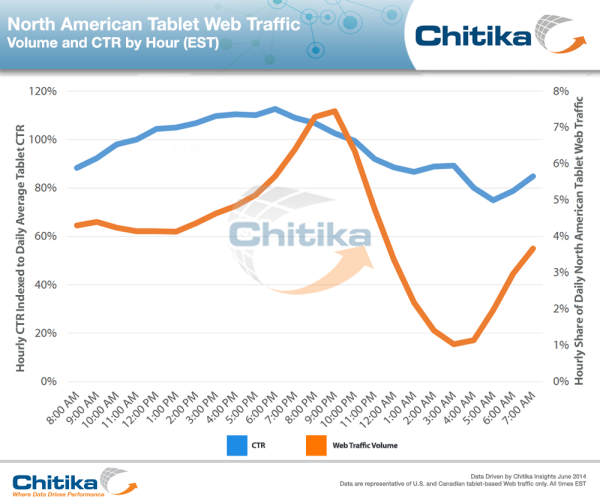
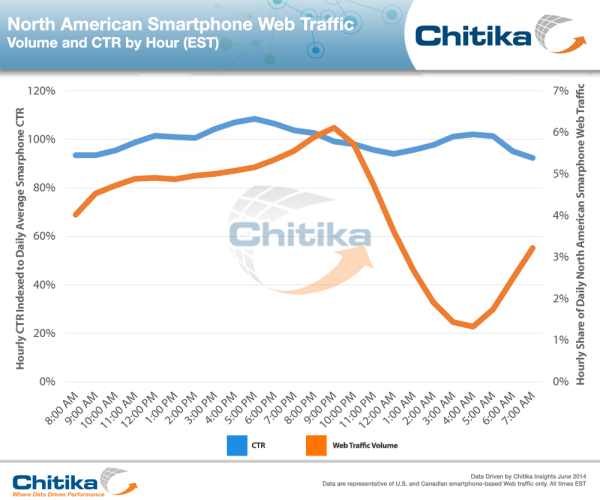
For each graph below, we first map a given device’s North American traffic volume at a single hour as a function of its share of average daily traffic (e.g., 5% of total daily smartphone traffic is generated at 9 a.m. ET).
Overlaid on that same graph is click-through rate (CTR) indexed to average daily North American CTR on that platform (e.g. average CTR is 100%, hourly figures will fall above and below that average).
Tablet Users
Tablets occupy a unique place in today’s computing environment. Hourly usage data suggest that leisure-hour uses of the devices remain the most pervasive, but also that there is a reasonable amount of activity during the normal workday.
While that isn’t too surprising, the CTR data demonstrate some unique trends in terms of how engagement rates on tablets vary throughout the day (and consequently, in typical use cases).

As Chitika Insights observed previously, the greatest amount of tablet usage volume is generated during the early evening hours (7-10 p.m. ET). Yet, the CTR of tablet users is highest directly preceding those hours, and as a whole, exceeds daily average CTR from 11am to 10pm ET. The answer to why this occurs is not clear cut, but there are a number of possible contributing factors.
Perhaps most importantly, and largely supported by a 2014 Flurry report, is that younger users are becoming more comfortable as compared to their older peers using tablets for work-related activities. That’s a type of trend that is likely only to accelerate over time as more people in that age group enter the workforce.
Additionally, studies have (not surprisingly) found that mobile device use goes up on the weekend, with the majority of the increase coming during those same early-afternoon and evening hours. While most of that usage is probably related to more leisure-type activities, considering the overlap, it is possible that those users are slightly more likely to click on ads during those periods.
So what does this mean for marketers? While leisure uses of tablets still represent the largest segment in North America, these daytime, likely more “utilitarian” tablet users are more willing than others to engage with ads, and presumably, other marketing efforts.
Smartphone Users
While this may be in the process of shifting, the activities users conduct on their smartphones are decidedly different from what users do on their tablets or desktops.
Opera MediaWorks found that when users are on their smartphones, aggregate activity trends much more heavily towards social media. This fits in with the context of why users choose to browse on their smartphones — among the three major device types (PCs, smartphones, and tablets) it’s likely the most personal platform.
This is reflected in an IDC report from 2013, finding that 79% of U.S. smartphone users have their devices with them 22 hours a day. While the survey’s sample size (7,446 users) may not make the study a definitive metric, it does highlight the larger trend that smartphones have become a more integral part of the daily lives of many consumers, particularly when it comes to younger age groups.
Not surprisingly, you can see this exemplified in actual usage and engagement figures:

The variance between peak and trough usage volume for smartphones is less than five percentage points – much more consistent as compared to tablets. Additionally, CTR remains virtually level throughout the day.
The takeaway: not only is smartphone usage fairly consistent at all hours of the day, but perhaps more importantly, engagement rates for those users are nearly identical regardless of the time. This, along with the earlier tablet figures, each present unique paradigms in platform usage that savvy marketers can use to their advantage in both campaign planning and execution.
Just keep in mind that in terms of overall usage volume, smartphones still significantly outweigh their tablet counterparts in North America, and this is unlikely to change anytime soon.
Contributing authors are invited to create content for MarTech and are chosen for their expertise and contribution to the martech community. Our contributors work under the oversight of the editorial staff and contributions are checked for quality and relevance to our readers. MarTech is owned by Semrush. Contributor was not asked to make any direct or indirect mentions of Semrush. The opinions they express are their own.
Related stories
New on MarTech