Paid search trends to watch for the 2019 holiday shopping season
Google Shopping will likely be the star of retail, and Maps will play a larger role for retailers with physical stores, but Amazon is poised to play the Grinch.
The holidays are here! That means search marketers everywhere are putting the finishing touches on strategies to make the most out of the next few weeks, the most important stretch of sales for many businesses.
However, don’t go into the holiday shopping season without reading up on these key trends which might help wrap up your strategy a little bit tighter.
Google Shopping will likely be the star of retail
It should be absolutely no surprise to retailers that Google Shopping is incredibly important to paid search success, and I’ve written about its rise many times over the years. This continues to be the case today, as Google Shopping accounted for 48% of all Google search spend in Q3 2019 for Tinuiti (my employer) retail advertisers. Advertisers should once again prepare for Shopping to play a key role during the winter holidays this year.
However, this Q4 and the months that follow will be an important time for both Google and advertisers in determining just how long Google Shopping can continue its torrid pace of growth, as we’re beginning to lap some shifts that happened at the end of last year that significantly drove up Google Shopping traffic.
As you can see from the chart below, Google Shopping click growth jumped from 41% last Q3 to 49% in Q4, and while growth has remained strong since, there has been a steady deceleration.
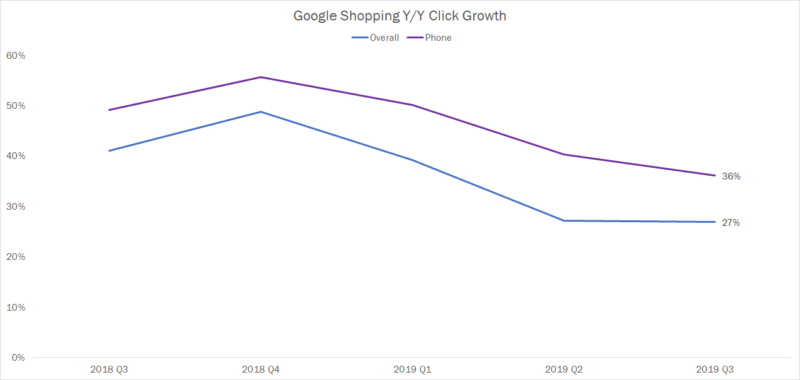
As has long been the case, phones in particular are driving much of the Google Shopping growth, and in Q3 2019 clicks grew 36% on phones compared to 27% overall.
The leap last Q4 coincided with an explosion in Google Shopping impressions, as Google seemed to prioritize Google Shopping over text ads. The impression growth was most pronounced on phones, where impressions increased 127% Y/Y in Q4 compared to 81% in Q3.
Some of this increase can certainly be attributed to newer, growing Shopping variations such as Showcase Shopping Ads, which produce advertiser-specific listings for more general searches.
The queries that trigger these ads tend to be about 20% shorter in terms of character count than the queries triggering traditional Google Shopping listings. While character count is far from a decisive metric with regards to determining how general or focused a search is, it does indicate that Google is finding shorter queries which likely include less product-specific qualifiers that it’s now showing Showcase ads for.
However, the impressive Shopping growth that occurred at the end of 2018 wasn’t just a matter of Google finding additional spots to throw Showcase ads, as true traditional Shopping listings also saw an explosion in growth. Taken together, the evidence points to a significant expansion in the share of search queries producing Google Shopping results.
All of this is to say that it’s unclear if Google Shopping has another big push like the one we saw last Q4 in it, or if Google has more or less used up its powder with respect to expanding these ad units to the extent observed at the end of 2018. As such, advertisers shouldn’t be shocked if Shopping growth is slower during the holidays this year than last year.
Nor should we be surprised if Google once again finds a way to push growth back up as it has so many other times. After all, the surge last year was unexpected, and Google’s latest additions of image search and YouTube inventory as well as additional Showcase-eligible product categories may help in a potential rebound.
Regardless, a rather large player you might have heard of stands ready to steal some Shopping clicks from under the tree.
Amazon poised to play Grinch more so than in past years
Much like the importance of Google Shopping, it’s difficult for U.S. retailers to be unaware of the trillion-dollar website in the room – Amazon. Even still, many retailers might be surprised to know just how dominant the ecommerce giant has become in Shopping over the last year.
This is most apparent when looking at Amazon’s Shopping impression share in apparel through Auction Insights reports. As of last October, Amazon was only barely visible in Shopping results against apparel retailers in the U.S., but that has changed rapidly.

Amazon’s impression share is now more than double what apparel retailers saw last December and has held steady for the last three months. In addition to impression share gains over the last year in other categories such as home goods, furniture and electronics, all signs point to Amazon more fully flexing its might in Google Shopping this holiday season.
Of course, given Amazon’s choice to take a couple days off from Shopping during Prime Day, it’s probably unwise for anyone outside of its paid search team to espouse confident opinions on its likely Q4 strategy. But the foundation seems laid for a bigger holiday presence than ever before.
What’s a competitor to do? There’s not much in the way of Amazon-specific advice for competing in Shopping, as competing with Amazon looks a lot like competing with any Shopping advertiser.
Stay on top of the queries triggering ads and funnel traffic effectively using keyword negatives. Keep feeds up to date and out of trouble by responding quickly to any warnings from Google Merchant Center. Take advantage of Shopping variations like Showcase ads and Local Inventory Ads (for brick-and-mortar advertisers) to ensure ads are eligible to show in as many different types of relevant scenarios as possible.
On the last point, Local Inventory Ads (LIA) are a nice differentiator for retailers with physical stores, since Amazon can’t offer the same in-store options. However, Amazon’s impression share is just as strong against LIA campaigns as traditional Shopping for many brands, so don’t think it won’t be lurking for searches with local intent as well.
Speaking of local intent – it’s time for my favorite paid search trend of the year.
Searchers turn to Maps for the Turbo Man dash
When it’s down to the Christmas wire and shipping cutoffs have left the prospect of getting a gift delivered in time shaky, many shoppers are forced to physical stores to make sure Jamie gets the right action figure.
This is readily apparent when looking at the share of Google text ad clicks which are attributed to the “Get location details” (GLD) click type, which comes predominantly from Google Maps according to Google. The chart below shows daily share for one national apparel retailer from last holiday season, for which GLD clicks accounted for 14% of all text ad traffic on 12/23 – the biggest daily share observed between November and December. A close second was Christmas Eve, with 13%.
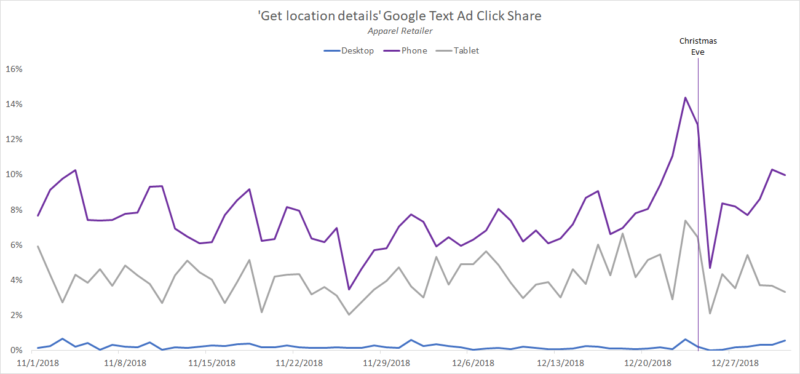
These figures can vary significantly by advertiser, but the general trend of GLD clicks spiking in the lead up to Christmas relative to other days of the year is very common among brands with a brick-and-mortar presence.
In terms of accounting for this, advertisers often look to results from last year to determine if they overspent or underinvested on particular days. If a brick-and-mortar brand were to only look at the online conversions attributed to ads in assessing the value of traffic on the last days leading up to Christmas, the picture may not provide a true representation of the value of that traffic given the huge offline intent on these days. This is true throughout the year for brands with physical stores, but made more glaring in situations like last-minute holiday shopping.
Given the way the calendar falls this year, last-minute shopping is likely to be hugely important.
Shortest holiday season since 2013 will make for a time crunch
The period between Thanksgiving and Christmas will be a full six days shorter this year than in 2018, and we haven’t had a Thanksgiving occur this late into November since 2013. As such, the race will be on for both consumers and brands alike.
History offers us a helpful test on the effects of a shorter holiday shopping period in the form of a 1939 decision by FDR to move the Thanksgiving holiday one week earlier at the request of retailers who hoped to drive more revenue from the holiday season. 23 states immediately adopted the new date (the third Thursday of November), while 23 others stuck to the original fourth Thursday of November. Two states chose to celebrate both.
After the holiday season, businesses reported that total consumer spending was similar across states that adopted the earlier date and those that stuck with the later date, indicating a longer period between the two holidays didn’t produce more spending. However, the distribution of sales revenue throughout the holiday season was different between the two, with the bulk of holiday shopping occurring in the last week before Christmas for states with the later date compared to evenly distributed throughout the holiday season for those celebrating the earlier date.
Using this as an indicator for how shopping might shake out this year (though there may have been one or two major developments in retail since 1939…), the shorter holiday season shouldn’t in and of itself reduce holiday-related sales for retailers. However, the last week ahead of Christmas might be especially important this year.
Most importantly, the U.S. settled on the fourth Thursday of November as Thanksgiving Day once and for all in 1941, meaning marketers will only have to deal with one Black Friday and Cyber Monday. And for that, I am thankful. Have a Happy Thanksgiving everyone.
Contributing authors are invited to create content for MarTech and are chosen for their expertise and contribution to the search community. Our contributors work under the oversight of the editorial staff and contributions are checked for quality and relevance to our readers. MarTech is owned by Semrush. Contributor was not asked to make any direct or indirect mentions of Semrush. The opinions they express are their own.
Related stories
About the author