Marketing Stats Toolbox: Mapping Tablet Usage Rates By State
Properly addressing tablet users presents an interesting challenge to marketers. In Google AdWords, for instance, traffic from desktops, laptops and tablets are grouped together for the purposes of advertiser bidding. Google explains that this is due to “users’ search behavior on these larger devices [being] very similar, and likewise, overall advertiser performance [being] very similar across […]

Properly addressing tablet users presents an interesting challenge to marketers. In Google AdWords, for instance, traffic from desktops, laptops and tablets are grouped together for the purposes of advertiser bidding.
Google explains that this is due to “users’ search behavior on these larger devices [being] very similar, and likewise, overall advertiser performance [being] very similar across these devices.”
Yet, when looking beyond search activity, tablet usage varies significantly from what is observed from desktops and laptops.
For example, a 2013 Chitika Insights study looking at device usage by time of day shows stark differences between what hours people are most active on tablets and desktops. Additionally, a Pew research study found that users preferred using their desktops and laptops for digital consumption of news over their tablet or smartphone by a substantial margin.
Most people would admit that they prefer to use their tablet or desktop for specific tasks. In general, consumption based activities like online video watching or casual gaming are typical on a tablet, while content creation like video editing and word processing are more natural activities for a traditional PC or laptop.
The latest trend of laptop-tablet hybrids are manufactured specifically to be a convenient means for consumers to switch based on context.
Certainly, a marketer’s efforts for the tablet platform should be informed by the preferences of the target market. While this does not necessarily need to take geography into account, it often is a major consideration.
Building off of a Chitika Insights report from late January, the corresponding map shows how tablet usage rates vary by U.S. state as a percentage of mobile app traffic.
The data are representative of hundreds of millions of U.S mobile app-based ad impressions catalogued through Chitika’s Cidewalk mobile ad platform. As with the previous study, the data presented here were drawn from a date range of December 25 through 31, 2014.
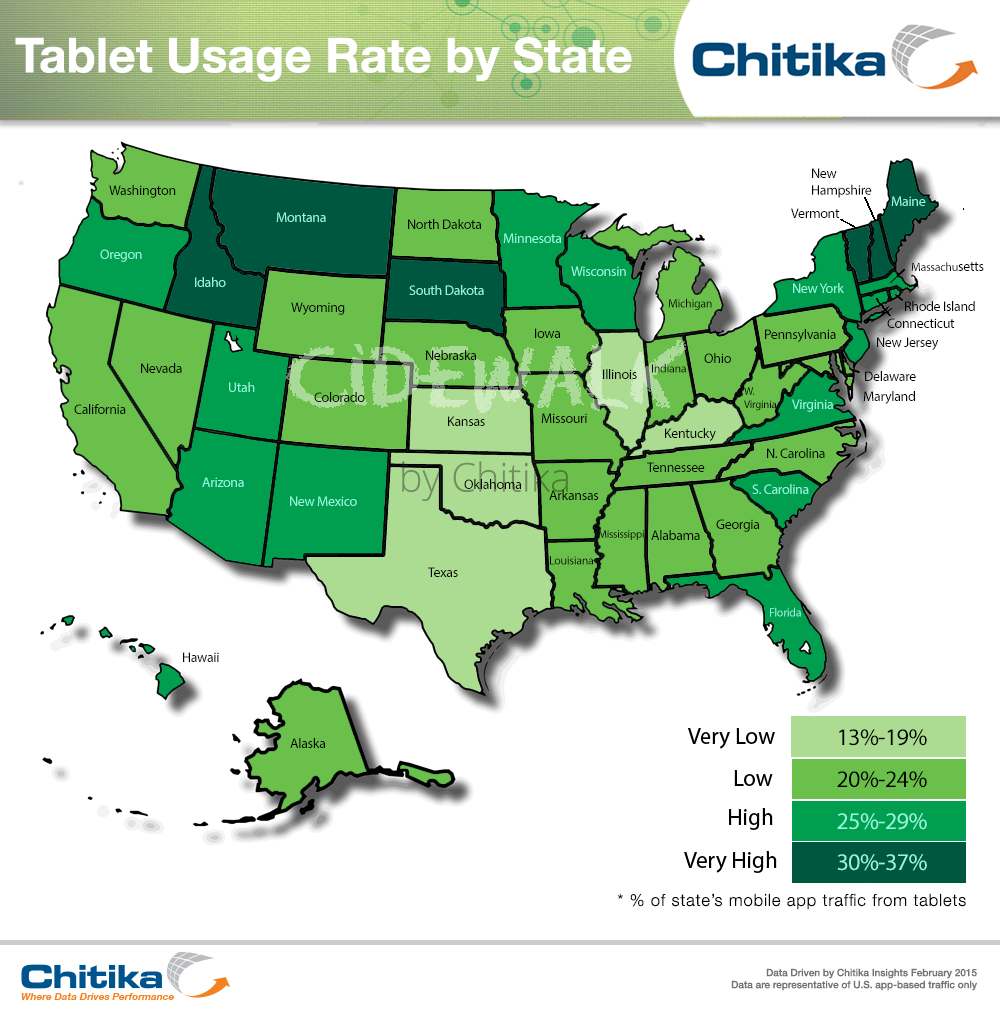
A full table of the results can be seen below:

Looking broadly, there do appear to be some regional trends, most visibly that New England states exhibit higher rates of tablet activity as a whole. However, more detailed information can be gleaned from performing a correlative analysis on the data with the help of some state-level U.S. Census and American Community Survey figures.
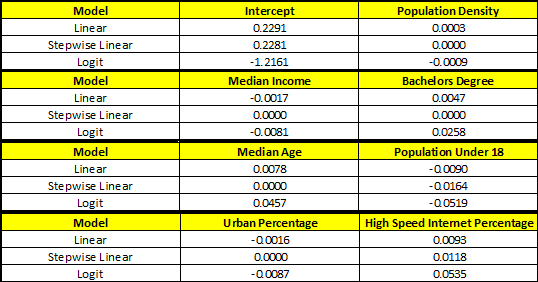
For the purposes of this study, we specifically examined an array of state-level variables relating to tablet share of mobile traffic based on the most recent data available:
- Population density (1)
- Median income (2)
- Median age (3)
- Percentage of residents with a Bachelor’s degree or higher (4)
- Percentage of residents under the age of 18 (5)
- Percentage of residents living in urban areas (6)
- Percentage of residents living in a household with high speed internet (7)
As data here are analyzed in aggregate, the method we chose for this analysis is weighted least squares regression. This was the preferred method, as the theoretical framework for weighted least squares regression allows data points representing a larger state (such as California) to have more bearing on predictive power than smaller states. You can read more about the methodology behind the analysis here.
The two variables that relate strongest to state-level tablet usage share are percentage of population under 18 (inversely correlated), and high speed internet penetration (correlated).
The high-speed internet penetration rate can be considered an expected relationship, as broadband-style internet makes a home connection shared amongst multiple devices much more viable. This is especially important considering that usage data points to tablets being used most frequently during the evening leisure hours typically spent in the home.
It may seem surprising that tablet usage rates generally trend lower in states with a greater percentage of children, especially considering that tablets are often used to occupy fidgety kids.
However, keep in mind how pervasive smartphones have become – particularly for children in middle and high school. The time spent using smartphones for this group is going to substantially outweigh the time spent on tablets.
While these are assuredly broader trends due to the state-, rather than city- or demographic-level data, it provides a view into how tablet usage has evolved roughly five years following the debut of Apple’s iPad.
It’s worth noting that the median state-by-state tablet usage rate is 24.7% of mobile traffic, and that 25 states exhibit tablet usage rates between 20 and 25%. As such, national-level marketers can take solace in the fact that there isn’t a tremendous degree of variability in tablet usage rates across the majority of the U.S.
However, for regional marketers, these differences in conjunction with other market data, can be very useful for understanding usage habits that help inform campaign planning, prioritizing any optimizations and general short-term strategy.
Contributing authors are invited to create content for MarTech and are chosen for their expertise and contribution to the search community. Our contributors work under the oversight of the editorial staff and contributions are checked for quality and relevance to our readers. MarTech is owned by Semrush. Contributor was not asked to make any direct or indirect mentions of Semrush. The opinions they express are their own.
Related stories
About the author