Comprehensively Track, Segment Site Performance With New Google Analytics Feature
Last week, Google made further improvement to its Analytics platform by adding Site Speed reports to help users analyze their site’s page load times, and allowing for greater granularity on site performance than previously available. The new Site Speed reports allows marketers to measure the execution speed and load time of user-defined events, such as […]
Last week, Google made further improvement to its Analytics platform by adding Site Speed reports to help users analyze their site’s page load times, and allowing for greater granularity on site performance than previously available.
The new Site Speed reports allows marketers to measure the execution speed and load time of user-defined events, such as how quickly an image or resource loads, to how long it takes your site to respond to a button being clicked.
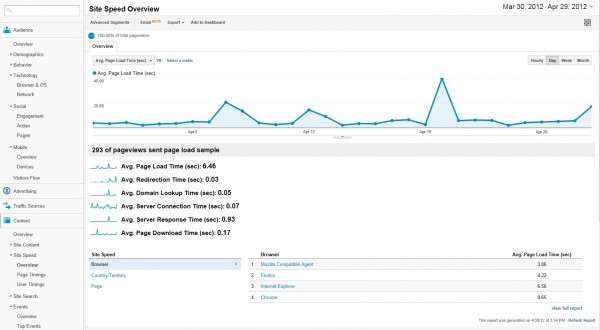
To increase the usability of the reports, Google broke them down into four main tabs: Overview, Explorer, Performance, and Map Overlay.
The Overview Tab displays a quick breakdown of key metrics across a range of variables, such as Browser, Geographic Location, etc. The value derived out of this 10,000-foot view ranges from macro to micro, as marketers can review the overall performance of their campaigns or gain insight into their success on a particular browser.
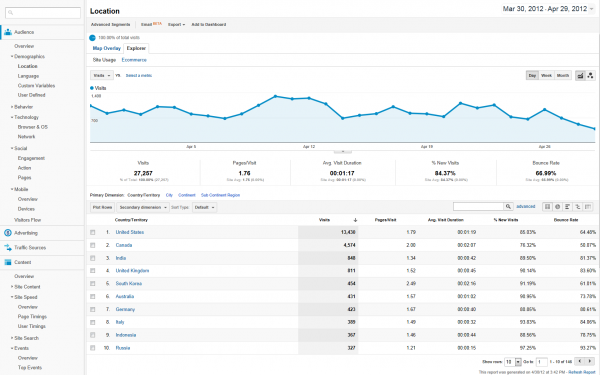
The Explorer tab lets you break down page and user timings across other dimensions for increased granularity. Breaking down these figures by secondary dimensions such as browser or country and putting them under the microscope can be instrumental in determining how speed and performance changes across your campaign.
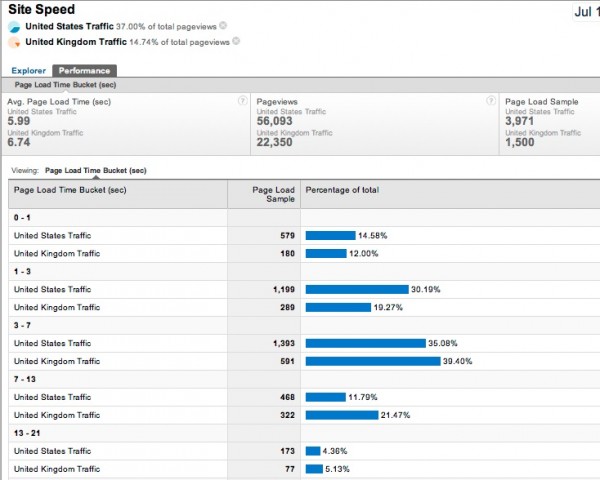
The Performance tab functions as a drop down of the Explorer view, which allows marketers to visualize the distribution of the timings for categories and variables specified in the Explorer tab. In separating timings into a histogram, Site Speed reports can help establish ranges of performance, as well as identifying areas which need improvement.
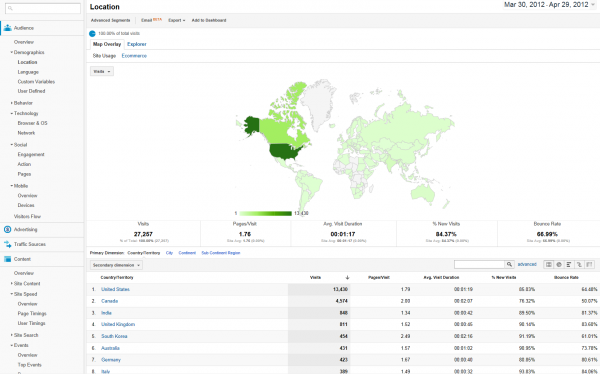
The Map Overlay tab displays a view of a site’s metrics across different geographical regions ranging from cities, to countries, to continents.
To collect User Timings data, just add JavaScript timing code to the interactions you want to track, using the new trackTiming API.
Google’s Matt Cutts has come out on record saying that speed will factor in to a sites ranking on the search engine in the future, highlighting the importance of an efficient campaign and easy-to-access site.
Contributing authors are invited to create content for MarTech and are chosen for their expertise and contribution to the martech community. Our contributors work under the oversight of the editorial staff and contributions are checked for quality and relevance to our readers. MarTech is owned by Semrush. Contributor was not asked to make any direct or indirect mentions of Semrush. The opinions they express are their own.
Related stories
About the author