Enterprise GA4—What to set up, customize, and do next
Unlock the full power of GA4 for enterprise. Learn how to scale tracking, customize reports, and extract insights that drive marketing and business growth.
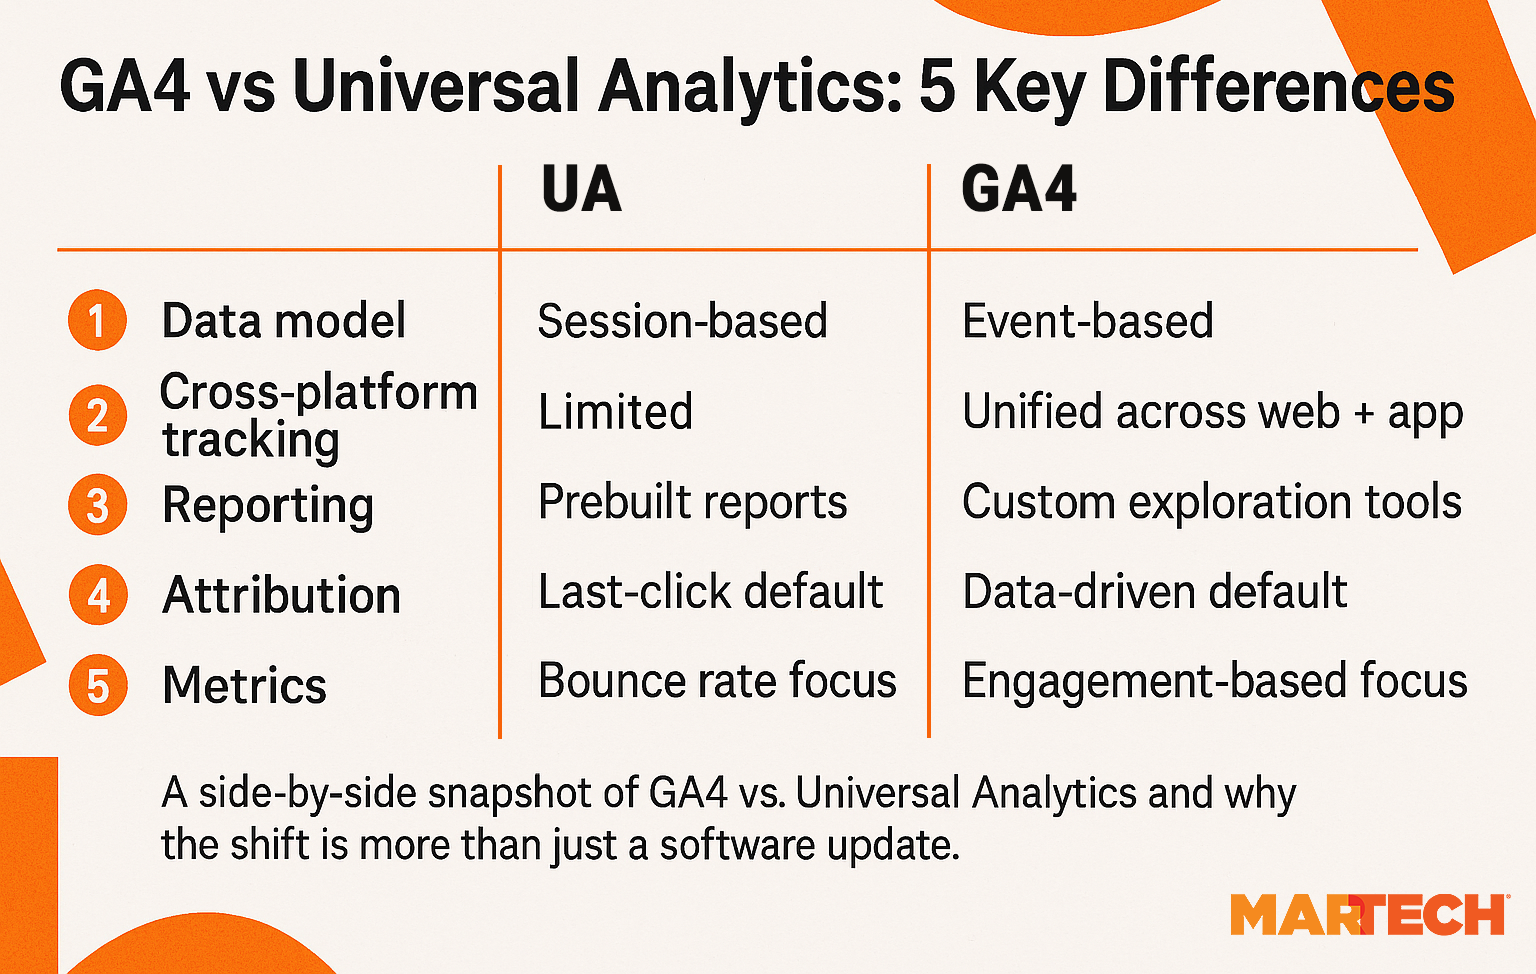
GA4 isn’t just an update to Universal Analytics (UA)—it’s a whole new way of thinking about how we measure what matters in website and campaign performance. Think back to the first time you heard about the switch from UA to GA4.
What did you notice right away?
The reports you relied on disappeared, the interface felt foreign, and suddenly you had to rethink how you track, report, and share insights across teams and brands.
For enterprise teams, this shift wasn’t just moving to a new platform. It meant recalibrating your whole approach. It can feel frustrating, especially when the numbers look different and there are fewer ready-made reports to lean on. The data model demands more setup, more strategy, and more coordination.
But here’s the thing: You can get through those early bumps. Really, you can. GA4 is designed to fit your business, your goals, and your teams—if you approach it the right way.
That’s exactly what we’re here for. We’ll walk you through the key areas to focus on, from governance and naming conventions to advanced features and audience building. Whether you’re refreshing your current setup or finally ready to build from scratch, we’re going to help you make GA4 work harder for you.
The result?
You’ll save time and deliver clearer insights while doing it so smoothly that you won’t even notice Universal Analytics is gone. Think of it like swapping an old map for a GPS that knows exactly where your business wants to go.
What is GA4?
Google Analytics 4 (GA4) is Google’s next-generation web and app analytics platform, built on an event-based data model rather than sessions. It officially replaced Universal Analytics (UA) on July 1, 2024, and is now the standard for all new properties.
While GA4 offers greater flexibility, cross-platform tracking, and improved integration with Google’s advertising stack, it also comes with trade-offs, especially for larger organizations used to UA’s baked-in simplicity.
Why GA4 feels like a necessary evil (but is actually a good thing)
Let’s be honest, for many teams, GA4 hasn’t been a smooth transition.
It’s technically more powerful—but in practice, it often feels like you’ve gone from a ready-made dashboard to a blank spreadsheet. Where UA gave you plug-and-play reports like “Landing Pages” or “Source/Medium,” GA4 asks you to build everything from scratch—from naming events to deciding which metrics even matter.
Even basic questions like “How many users visited our product pages from organic search?” can take several steps to surface, especially if the data layer or tagging was rushed.
And yes, the learning curve can be steep.
Terms like event_scope, session_engaged, and thresholding don’t mean much unless you’ve spent time in the weeds. The difference between an event parameter and a custom dimension is not always clear. And you’re not alone if you’ve ever been hit with a blank report because of quota limits or sampling.
As a result, many enterprise teams are under-utilizing GA4 by only relying on out-of-the-box views that don’t reflect actual business performance or they are leaving ownership entirely to dev or analytics teams with no cross-team alignment.
But here’s the thing: GA4 isn’t broken or complicated—it’s just under-configured.
Once you treat it less like a product and more like a platform that needs shaping, it becomes something far more powerful. And that’s what this guide is here to help with.
Your Attribution Model is Missing 40% of Brand Discovery
✓ Track brand mentions across all AI search platforms in real-time
✓ Connect AI-driven discovery to your existing analytics
✓ Measure sentiment and accuracy of every AI mention
Enterprise-grade AI tracking. Finally.
Enterprise teams are feeling the friction
For smaller teams or single-site setups, GA4 can be workable straight out of the box. But for enterprise organizations with multiple brands, markets, properties and teams, the cracks quickly start to show:
Limited support for governance at scale
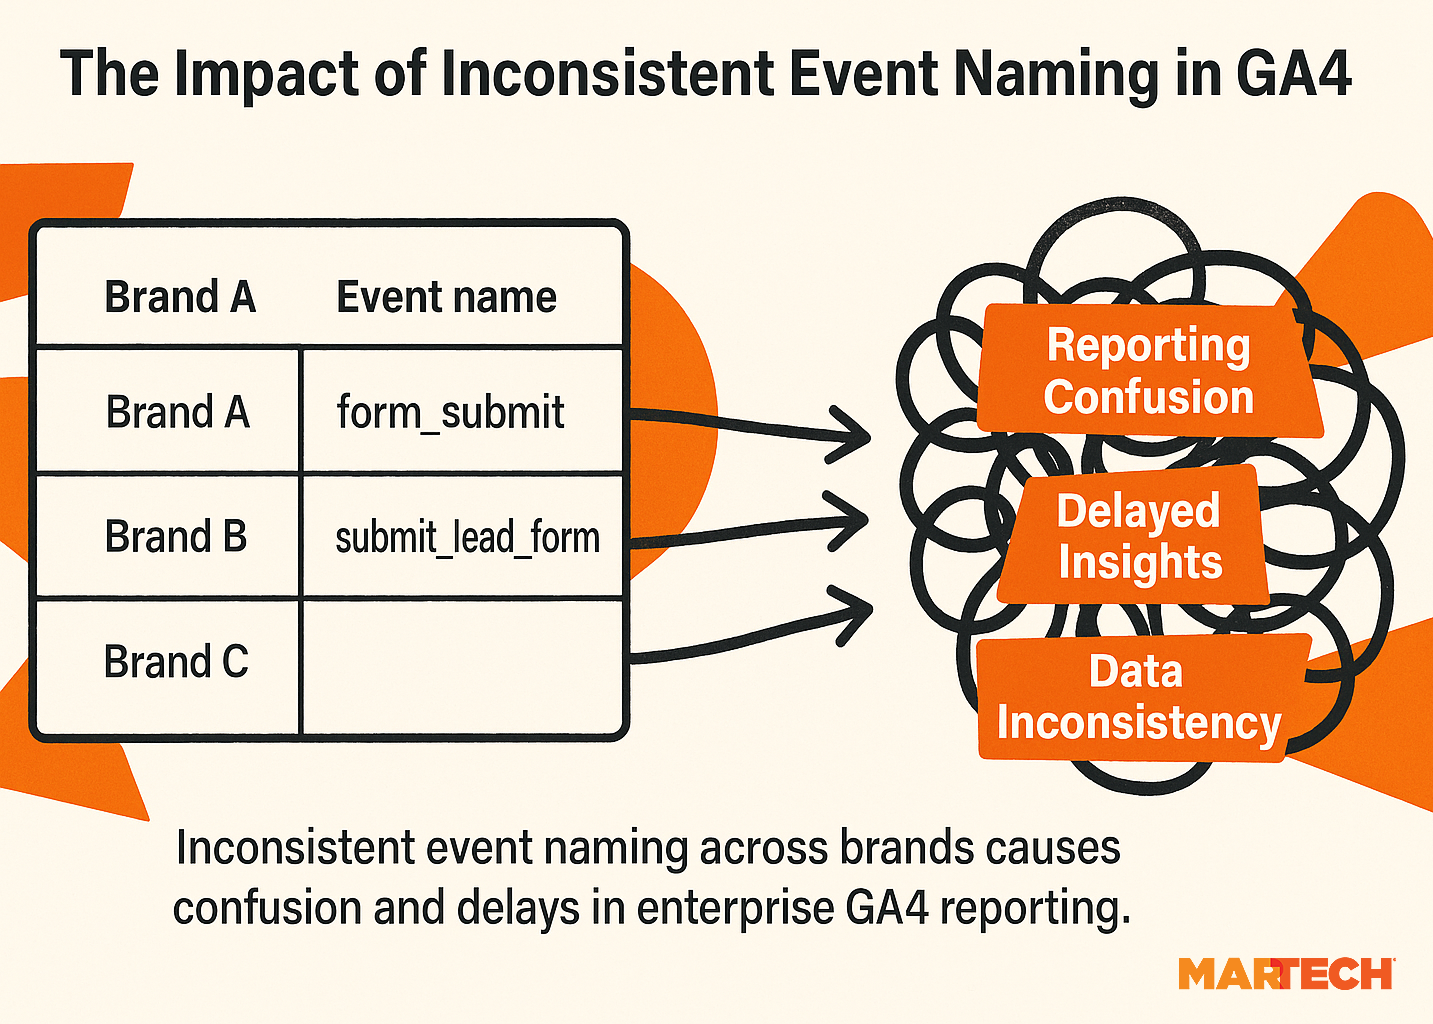
There’s no built-in way to standardize tracking across teams. If your ecommerce team is tracking add_to_cart while your blog team is logging it as cart_add, GA4 won’t reconcile this discrepancy.
Without a shared playbook, you’ll end up with duplicated events, missing data, or metrics that mean different things to different teams.
For example, one brand tags “Form Submit” as a conversion, another uses “Submit Lead Form,” and the third doesn’t tag it at all—even though they’re all tracking the same CTA.
Confusing UI for complex organizations
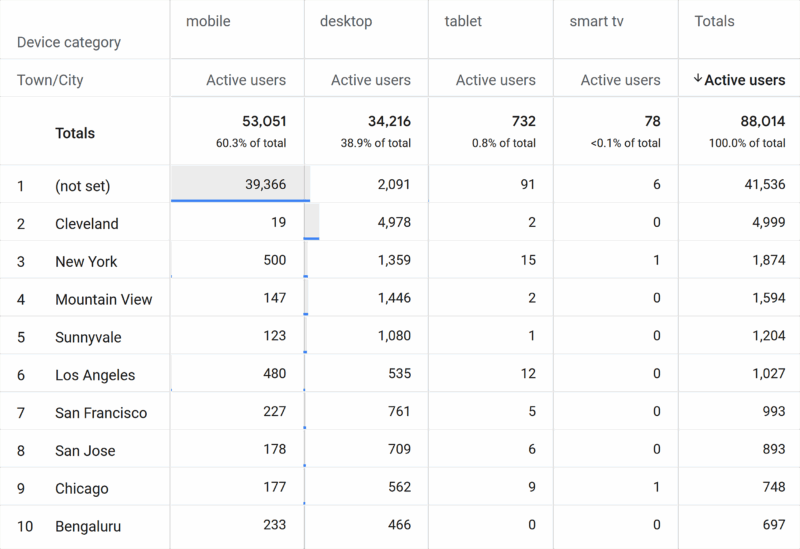
There’s no clean way to view performance across brands or regions unless you’ve invested in layered dashboards or built your own property-switching setup.
You might have 5+ GA4 properties, each set up slightly differently—and comparing how “organic traffic converts on PDPs” across all of them can easily become a manual data-pull mess.
Even switching between user interfaces or comparing funnel drop-off can turn into a time sink. There’s no “helicopter view” baked in.
Weak support for channel-specific reporting
GA4 doesn’t give you the classic “channel group” breakdowns the way UA did, and even when it does, they’re often too broad or don’t reflect your actual campaign structure.
Let’s say you want to see SEO performance by funnel stage—top vs. mid vs. bottom—across landing pages. That’s not in GA4 by default.
You’ll have to create a custom dimension, then build an Exploration to filter by event parameters, and possibly link it to Looker Studio just to clearly visualize it.
For busy teams, that’s a lot of effort to get what used to be a two-click report.
Data caps and sampling thresholds
GA4 enforces strict quotas on Explorations and reporting. If you’re a high-traffic site, that means you’ll run into thresholds fast.
Imagine trying to view detailed engagement for a product page with over one million sessions, but GA4 tells you “data thresholding applied,” and suddenly your chart’s empty. That’s not just annoying; it means real insight gaps, especially for long-tail content or deep funnel behaviors.
Missing legacy benchmarks
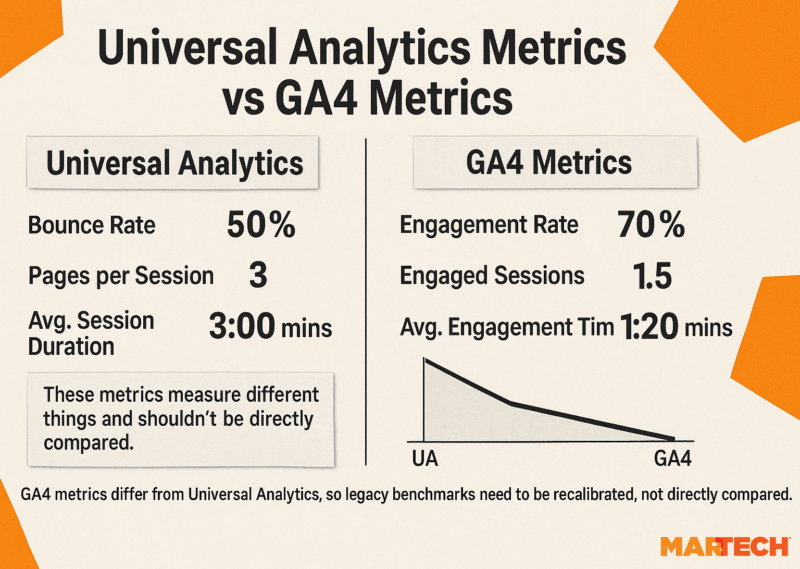
You can’t directly compare your GA4 data to UA because the tracking model is different, the sessions behave differently, and metrics like “bounce rate” or “pages per session” don’t work the same way.
If you were reporting three-minute average session durations in UA and now you’re seeing one minute 20 seconds in GA4, it’s hard to know whether that’s a drop, a shift, or just a different measurement entirely.
This makes it harder to tell whether things are improving or just different.
The upside of GA4: Customization = competitive advantage
Yes, GA4 can be frustrating, especially at scale. But the very things that first make it harder to use are what make it so powerful in the long term.
Because GA4 doesn’t assume how you want to measure success, you get to define it. You decide which actions count, which audiences matter, and which signals to track. The result is a measurement setup that reflects how your business actually works and not just someone else’s template.
Done right, this opens the door to:
- More relevant reports for each function or brand
- Cleaner data and clearer benchmarks across teams
- Deeper insight through BigQuery and joined datasets
- And a repeatable framework that supports scale
And that’s exactly what we’ll help you build—starting with the most common mistakes holding teams back.
Common GA4 mistakes enterprise teams make
GA4’s flexibility is a gift—but only if you know how to use it. In enterprise settings, the same freedom that enables powerful reporting can lead to fragmentation, blind spots, and unnecessary complexity.
Below are some of the most common pitfalls we’ve seen and how to avoid them.
Over-relying on default reports instead of building Explorations
Default reports are a useful starting point, but they only scratch the surface of what GA4 can do. And for most enterprise teams, they don’t cut it.
Say your content team wants to understand scroll depth by content category. Or maybe your product team wants to track the full journey from on-site search to lead conversion. The default reports won’t get you there.
Instead, make Explorations your strategic go-to
1. Identify key business questions
Start by listing what your teams really need to know. For example:
- Which landing pages drive the most conversions?
- How do users move through our funnel?
- What’s the overlap between paid and organic audiences?
2. Build reusable Exploration templates
Create Explorations for these questions using segments, custom dimensions, and funnels—then save and share them. This means teams don’t have to start from zero every time.
3. Use visualizations that fit the story
GA4 Explorations let you choose from funnel reports, pathing, segment overlaps, and more. Pick the chart type that helps teams spot insights quickly, not just numbers on a page.
4. Train teams on how to use and adapt Explorations
Make sure your analysts, marketers, and product teams know how to tweak these reports to their needs. This boosts adoption and cuts down on “data requests.”
5. Review and iterate regularly
Business goals and questions evolve, so keep Explorations fresh by revisiting and updating them quarterly. Remove what’s stale, and add new ones for emerging priorities.
Not aligning GA4 tracking with business-level KPIs
GA4 lets you track nearly anything, but if you don’t define what matters up front, it’s easy to end up measuring everything and learning nothing.
A classic example is tracking button clicks, scroll events, or time on page but without any link to actual business outcomes, like demo requests, account activations, or LTV.
This often happens when GA4 is set up by someone technical but without strategic input. You get a lot of data but not a lot of insight.
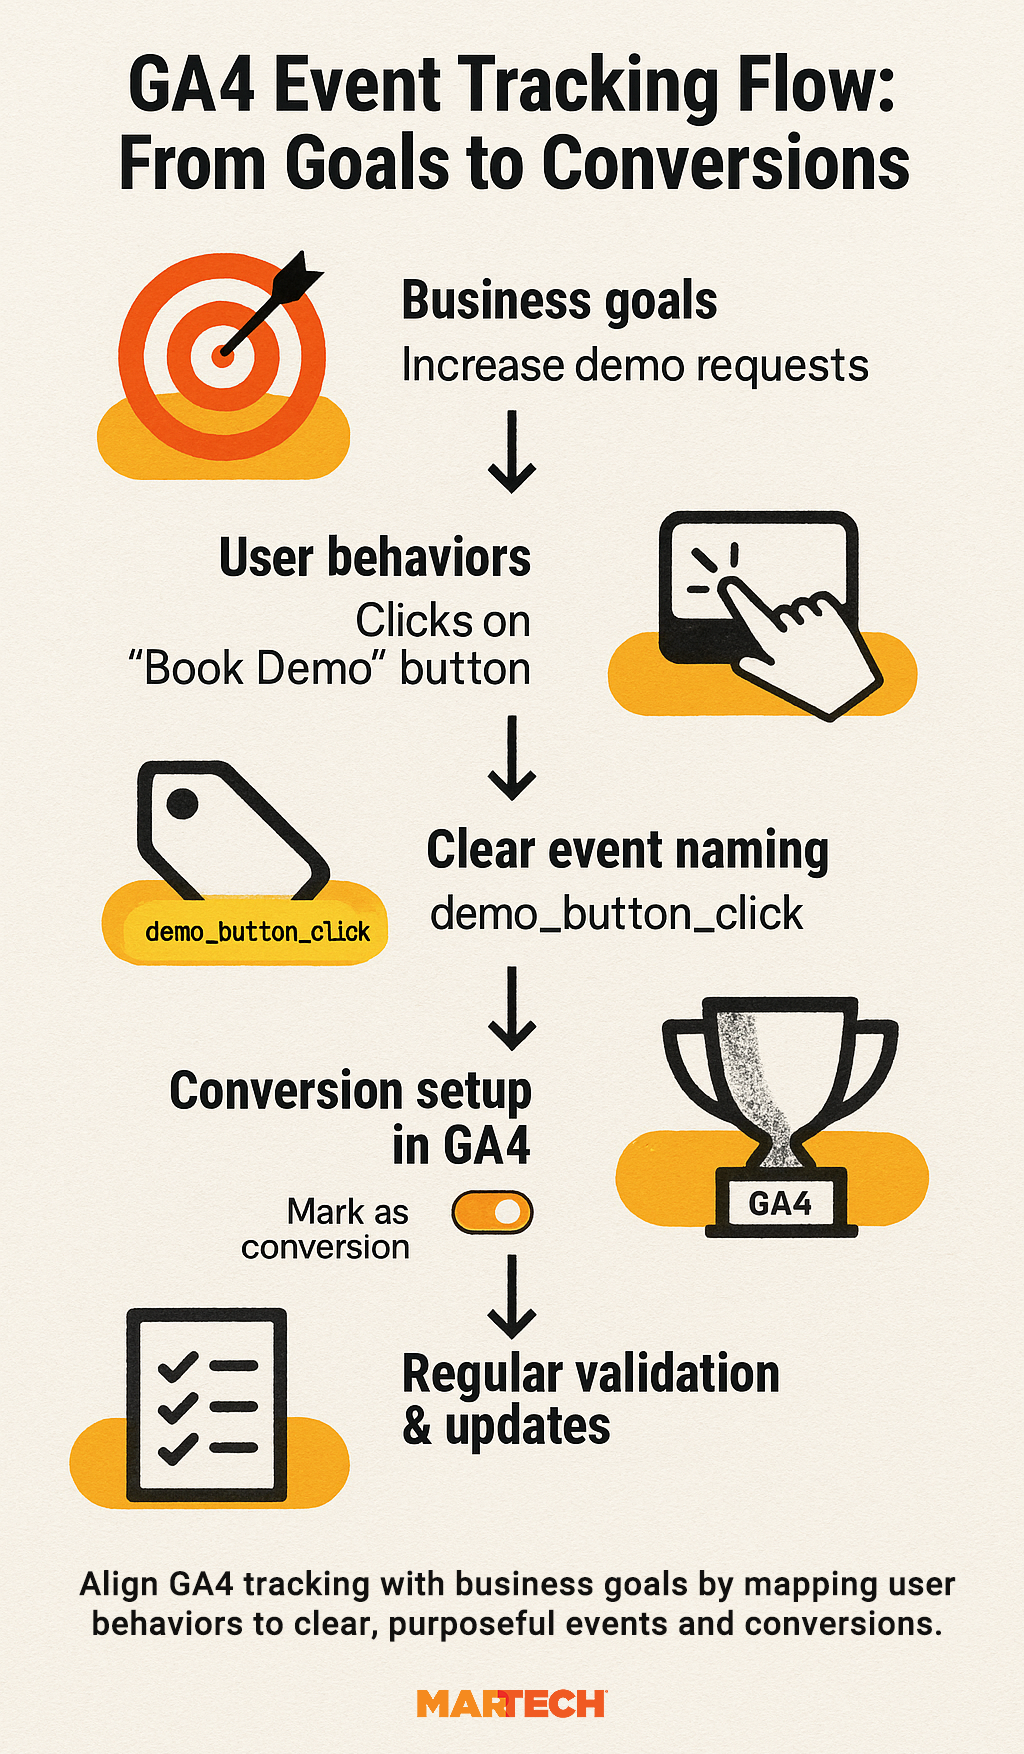
Instead, make GA4 tracking serve the business
1. Start with your business goals
Sit down with stakeholders across marketing, product, and sales to identify what success looks like. Is it sign-ups? Purchases? Retention? Knowing this guides your measurement strategy.
2. Map business goals to user behaviors
Identify the user actions that indicate progress toward these goals—such as “started free trial,” “completed checkout,” or “watched onboarding video.” These become the key events to track.
3. Name events with purpose and clarity
Use meaningful, standardized event names that reflect the business action, not just technical interactions. For instance, demo_request_submitted instead of button_click_123.
4. Set up conversions around key events
Mark the most important events as conversions in GA4 so they’re front and center in reporting and alerts.
5. Regularly validate and update tracking
Business priorities evolve, so revisit your KPIs and event setups every quarter to ensure GA4 data stays relevant and actionable.
Letting web devs or junior marketers own implementation
GA4 is powerful, but it’s not just a technical tool. When implementation is handed off entirely to a developer or junior marketer without proper context, things can quickly go off-track.
For example, devs might track every click event on a page but skip the key actions that drive revenue. Or a marketer might set up events for campaign tracking but not consider naming conventions, scopes, or how those events roll up into quarterly KPIs.
Instead, treat GA4 implementation as a strategic, cross-functional collaboration
1. Create a measurement plan with input from multiple teams
Start with a shared doc that outlines what you’re measuring and why. Get input from marketing, product, sales, and data teams (not just the person setting up tags).
2. Assign ownership—but not in isolation
Your developer or marketer might build the setup, but someone with business context should guide what is being tracked and how it’s interpreted.
3. Clearly document standards
Set clear naming conventions for events and parameters (e.g., form_submit vs. signup_form_submit), and make them easily accessible in an internal wiki or SOP.
4. Use GTM workspaces and approvals
If you’re using Google Tag Manager, use workspaces for different teams and implement an approval process before publishing. This keeps things tidy and avoids surprise changes.
5. Train and upskill the team
Provide hands-on GA4 training sessions or Loom walkthroughs so marketers, analysts, and devs all understand the full pipeline from tag to insight.
Failing to connect GA4 with BigQuery, Looker Studio, or internal BI tools
GA4 is more than a reporting tool; it’s also a data pipeline. But many teams stop at the default dashboards, missing the real value of exporting their data for deeper, joined-up insights.
Here’s the issue
While GA4’s interface gives you directional trends, it lacks the flexibility to ask more strategic questions—like LTV by acquisition source, or user journeys across multiple sites and products. Without exporting to BigQuery or your preferred BI tool, you’re stuck with sampling, limited dimensions, and static visuals.
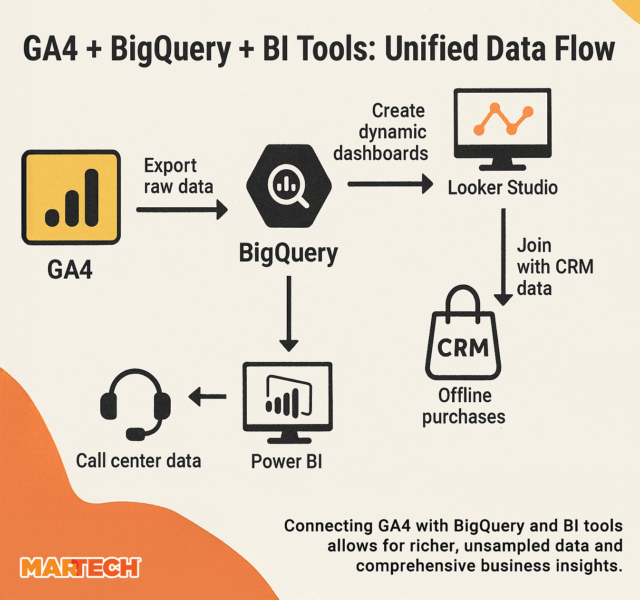
Instead, make GA4 the start of your insights stack—not the end
1. Enable the BigQuery export early
GA4’s free BigQuery connector lets you export raw, unsampled event-level data daily. Turn this on as soon as you can, even if you’re not yet ready to analyze it. You’ll thank yourself later when you need historical data.
2. Build dynamic dashboards in Looker Studio or Power BI
GA4’s default reports are static. Instead, build tailored dashboards in Looker Studio or your BI tool of choice.
Want a report that shows SEO landing pages by funnel stage? Easy.
Want to break down content performance by region and campaign? Done.
3. Join GA4 data with other sources
Combine GA4 data with CRM, sales, or email data to get a full-funnel view. For example, how many leads from organic search converted into customers and renewed after six months?
4. Set up scheduled queries and alerts
Use BigQuery to write custom queries (e.g., cart abandonment by device and location), then set up alerts when key metrics dip or spike. This is especially useful for performance marketing or ecommerce teams.
Setting up GA4 as a “one-size-fits-all” solution across brands or regions
If you’re managing multiple brands, business units, or websites, it might feel easiest to roll out one shared GA4 setup across the board. While consolidation sounds efficient, it sometimes creates more confusion than clarity.
Here’s what typically goes wrong:
- Generic event names that don’t match brand-specific behaviors
- Bundled data streams that make it hard to filter by site or team
- Conflicting KPIs where one team’s “conversion” is a sale, and another’s is a newsletter signup
The result? Internal teams can’t get the insights they need, and the numbers lose credibility with leadership.
Instead, think modular, not monolithic
1. Use shared naming conventions, but let brands tailor the details
For example, you might follow event_type_detail across all brands, but let each one define their own detail to suit user journeys.
2. Create separate properties or streams per brand or business line
If teams operate semi-independently, avoid squeezing everyone into one property. Instead, connect reporting later via Looker Studio or your BI tool.
3. Set unique KPIs per brand or site
Don’t force the same goals on all teams. Let each one track what truly matters—whether that’s sign-ups, purchases, content engagement, or something else.
4. Document everything centrally
A shared spec, tracking plan, or internal wiki goes a long way. It keeps everyone on the same page, even when setups vary slightly.
Framework: How enterprise teams should approach GA4
If GA4 feels chaotic, you’re not imagining it. But it’s not unsolvable, either. The trick is not to treat it like a plug-and-play tool but instead like just the start of your measurement strategy.
Below is a simple framework to help your team take a more intentional, scalable approach to GA4 that aligns with your business, rather than the platform.
1. Map business objectives to measurement strategy
If GA4 feels messy or misaligned, it’s likely because it’s been set up without first anchoring to what the business actually wants to achieve. Before anything else, enterprise teams need to map top-level goals—growth, efficiency, retention, revenue—into a clear measurement plan. Otherwise, you’re just collecting numbers with no narrative.
Let’s say the business wants to increase self-serve sign-ups across multiple markets. That needs to show up in your GA4 tracking structure—not just as a generic form_submit event, but with parameters for product line, language, and campaign source. Without that alignment, you’ll struggle to answer even basic performance questions.
Take the time to ask your team:
- What are the three most important outcomes we’re driving right now?
- What data do we need to know if we’re getting there?
- And how should that be reflected in our tracking?
The next step?
Build or refine your measurement framework so it mirrors those outcomes. This will guide everything that follows, especially your KPIs, events, and naming conventions.
2. Align KPIs by department
When teams don’t have their own KPIs clearly defined in GA4, they tend to fall back on vanity metrics or whatever’s easiest to pull. But if you’re in an enterprise organization, you need clarity on what performance looks like—channel by channel, team by team.
SEO might care about scroll depth, indexed pages, and branded vs. non-branded traffic. Product might be interested in funnel progression or feature adoption. Revenue teams want clean attribution. If you don’t plan for all of that upfront, you’ll end up with mismatched reporting, unclear targets, and stakeholders who can’t trust the data.
Use this as a prompt with your leads:
- What metrics do you genuinely care about?
- Which events should be tracked as signals of success?
- What counts as a conversion in your world?
Then check: Is that visible and usable in GA4 right now?
From there, you can start customizing the interface, reports, and Explorations to reflect each department’s needs instead of forcing everyone to use the same default view.
3. Use custom dimensions and metrics to support OKRs
Out of the box, GA4 can only take you so far. If you want to track performance against meaningful OKRs, you’ll need to lean into custom dimensions and metrics.
Think about this: One of your objectives is to increase engagement with a new tool feature. You’re already tracking “clicks,” but that’s not enough. What you actually want to know is who’s engaging, where they came from, how often they return, and what drives them to convert.
With custom dimensions (like feature version, user type, or logged-in state) and custom metrics (like time spent interacting with the tool), you move from surface-level tracking to insight-rich measurement.
Ask your analytics or product team:
- Are we capturing the full context of our most important user behaviors?
- What extra dimensions would give us a clearer view?
- Where do we need to go beyond the defaults?
Once you’ve scoped that out, prioritize implementation in your next dev cycle. These custom definitions don’t just improve GA4 reports, they power everything downstream, from Looker dashboards to retention models.
4. Get governance right
For enterprise teams, scale breaks everything if you don’t govern it well. And GA4 doesn’t enforce structure for you—you need to set it up intentionally.
That starts with naming conventions.
- Are your events named clearly and consistently?
- Do parameters follow a documented format?
If not, you’ll end up with a jungle of data no one trusts.
Say one region calls a download event download_file, another uses fileDownload, and a third logs it as dl_click. That’s three teams, one behavior, and zero comparability. Multiply that across dozens of brands or markets, and good luck making sense of the data.
You’ll want to define standards and capture them in a shared internal playbook. This should also include permission tiers of who can edit tags, who has read-only access, and how new events get approved. Add in regular audits (monthly or quarterly) so things don’t drift.
Ask your team leads:
- Who’s currently maintaining our GA4 implementation?
- Is there a single source of truth?
- Are there blind spots we’re not catching until it’s too late?
Getting governance right isn’t glamorous, but it’s what makes GA4 scale without spiraling.
5. Use GA4 as a gateway to your analytics stack
GA4 isn’t the end goal, it’s the starting point. For most enterprise teams, its real value comes when it’s connected to the broader stack.
That means exporting raw data to BigQuery for deep, unsampled analysis. It means layering on Looker Studio with filters tailored to each team so SEO sees organic landing page data, paid sees return on ad spend by campaign, and product sees event flows. And it means feeding GA4 data into your data warehouse, where it can sit alongside CRM, sales, and support data for richer insights.
If you’re not there yet, don’t worry.
Start by asking:
- What do we need that GA4 can’t do on its own?
- Is it unsampled data, historical views, better dashboards, or joined-up attribution?
Then map out the integrations that would solve those gaps. Even a lightweight connection to Looker or BigQuery can unlock a new level of usability for teams drowning in default reports.
How to structure enterprise-level GA4 tracking
Getting GA4 to work well at enterprise scale comes down to clarity. When you’re managing multiple brands, regions, or product lines, it’s not enough to tag everything and hope it makes sense later. You need structure. Otherwise, reporting gets muddy, insights get delayed, and no one’s quite sure what the numbers are really saying.
Let’s walk through what a good structure actually looks like, starting with events.
Event design at scale
Enterprise teams often make the mistake of copying and pasting the same event setup across sites, or worse, letting each brand do its own thing. That might work when you’re small, but at scale, inconsistency is your biggest hindrance.
You need a shared language and a clear tagging framework that keeps things tidy across properties, products, and markets.
Use a naming convention like category_action_label or namespace:action.
It doesn’t matter what your naming convention is, as long as it’s consistent. You might go with something classic like form_submit_signup or video_play_demo, or use colons to namespace actions like checkout:start or blog:scroll. What matters is that anyone looking at your data—whether analyst, marketer, or dev—can understand what an event means at a glance.
It also means your reports stay readable. Compare “cta_click,” “btn_click,” and “ctaPressed” to something like “homepage:cta_click”—the latter is just easier to work with and understand.
Ask your team: Are we using a standard naming structure across brands and products? If not, now’s the time to align.
Tagging strategy for multiple brands/products in the same property
If you’re running multiple brands or product lines under a single GA4 property, tagging needs to tell you which one a user is interacting with. That could mean including the brand name in your event names (brandA:checkout_complete, brandB:checkout_complete) or tagging events with a custom parameter like brand=brandA.
This becomes especially important when product teams or content leads want brand-specific data. If you haven’t tagged at that level, you’ll spend hours trying to reverse engineer it.
Pro Tip: Use a productLine or brandName custom dimension and apply it across all events. That way, every report can be filtered by brand without needing a separate GA4 setup.
Set custom dimensions
Custom dimensions are how you get past GA4’s generic reports and into territory that actually reflects your business structure. They allow you to slice data in meaningful ways (by business unit, funnel stage, user segment, or market).
Let’s say you’re a global business with a mix of B2B and B2C units. You’ll want a businessUnit dimension to separate enterprise leads from ecommerce buyers.
Or if your sales process has clear funnel stages—like lead > MQL > demo > closed—you could use a funnelStage dimension to understand which content moves users forward.
You can also tag users by language (lang=en), region (market=US), or even behavioral segments like userType=new vs. userType=returningEngaged.
These kinds of filters make GA4 genuinely useful, especially when different teams are asking, “What’s happening in my part of the business?”
Ask your team: What filters or groupings do we wish we had in GA4? Those are your custom dimensions.
Account/property structure
Correctly structuring your account helps you avoid messy handovers, access issues, and reporting silos. But there’s no one-size-fits-all. The best structure depends on how your business operates, how centralized your analytics team is, and how clean you need the data to be across brands or regions.
When to use multiple properties vs. multiple data streams
A common question: Should you use one property with different data streams or separate properties for each brand or site?
Here’s a simple way to think about it:
- Use multiple data streams in one property if you want to analyze cross-site behavior. Say, if users move between your .com and .co.uk sites, or if your brands share the same audiences and teams.
- Use separate properties if the businesses operate independently, have different compliance needs, or need completely distinct GA4 setups.
For example, if your parent company owns both a retail fashion site and a financial services product, those should probably live in separate properties. But if you’re running one core SaaS platform in multiple languages or markets, a shared property with different data streams might be more efficient.
Ask your team: Do we want unified reporting, or is separation safer?
Centralized vs. decentralized analytics governance
Lastly, who actually owns your GA4 setup? In many enterprise teams, there’s confusion about whether analytics lives with marketing, product, engineering, or BI.
A centralized model means a core team manages all tagging, naming, and governance. It’s slower to execute but keeps data quality high. A decentralized model gives teams more autonomy to tag what they want but risks duplication and inconsistency.
Most mature organizations land somewhere in-between: A central team sets the rules, provides templates, and does regular audits, while functional teams build their own reports within that framework.
Ask your team: Who decides what gets tracked, how it’s named, and where it lives? If the answer is “it depends,” it’s probably time to tighten governance.
Winning features advanced GA4 users should be using
Once your tracking is clean and your teams are aligned, GA4 can do a lot more than just track page views and button clicks. The platform has a set of powerful tools just beneath the surface, designed to help advanced users unlock behavioral insights, troubleshoot quickly, and tie analytics into the wider business stack.
If your team isn’t using these advanced tools yet, you’re probably leaving value on the table.
Explorations: Custom pathing, segment overlap, and funnel analysis
This is where GA4 starts to feel like a proper analytics platform.
Path exploration lets you see how users actually move through your site—no need to guess. For example, you can start with session_start and follow what percentage of users hit a product page, then a pricing page, then drop off before checkout. You might discover your top exit path is from the FAQ page right after users read about shipping costs.
Segment overlap is great for audience discovery. Say you want to know how many users who watched a demo video also returned within seven days and added a product to their cart. You can overlap these behaviors visually and create a new audience from the sweet spot in the middle.
Funnel analysis is how you build step-by-step conversion journeys—even retroactively. Let’s say your ideal signup flow is:
Homepage →Feature page view →Pricing →Signup form view →Thank you page
You can build this funnel, see where drop-off is highest, and break it down by traffic source, device, or geography. These kinds of insights are gold for performance marketing, CRO, and UX teams.
Ask your team: Are we still relying on standard reports when we could build live funnels and journey maps that reflect how people actually behave?
Audiences: Set conditions for remarketing, churn detection, and loyalty cohorts
GA4’s audience builder isn’t just for “all users” or “visited X page.” You can use it to create behavioral audiences that feed into ad platforms, UX experiments, or lifecycle campaigns.
For instance:
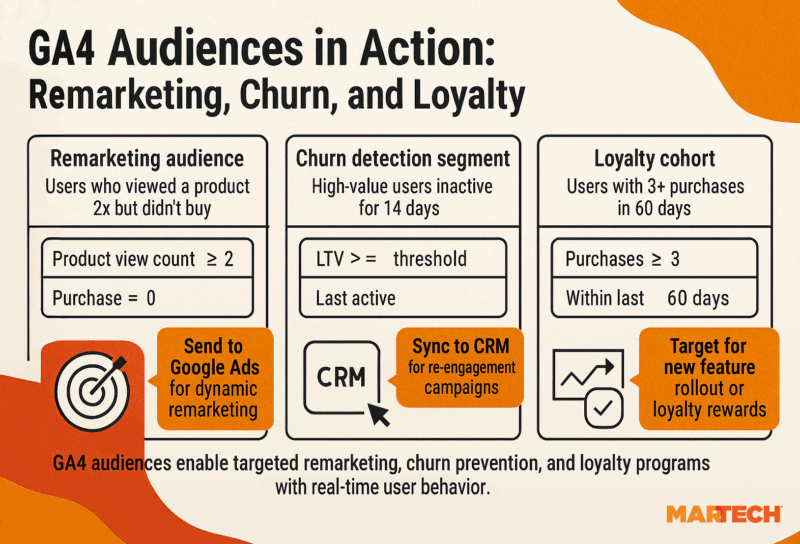
Remarketing
Remarketing audiences let you re-engage people who showed interest but didn’t convert. For example, users who visited a product page twice but didn’t add anything to their cart are signalling intent—they’re close, but something’s holding them back.
By building an audience of these visitors, you can target them with tailored ads reminding them of the product or offering a discount. It’s about catching potential customers right before they slip away, making your ad spend smarter and more effective.
Churn detection
Churn detection audiences include valuable customers who haven’t come back in a while—say, high lifetime value (LTV) users who haven’t returned in 14 days. This helps you flag potential drop-offs early so you can send targeted win-back campaigns or personalized offers before they disappear for good.
Without this kind of audience, you might only notice churn after it’s too late to react. You’re essentially shifting from reactive to proactive retention.
Loyalty cohorts
Loyalty cohorts highlight your repeat customers, those who bought three or more times in the last couple of months, for instance. These customers are your brand champions, more likely to try new features or engage with loyalty programs. By isolating this group, you can tailor communications or early access invites that deepen their relationship with your brand. With this strategy, you’re shifting from acquisition to nurturing long-term value.
Because GA4 audiences update in real time, you can act on intent as it happens, not after it’s too late.
Ask your team: What user behaviors do we wish we could target, segment, or reward?
DebugView: Real-time troubleshooting with GTM and server-side tracking
DebugView is your GA4 x-ray vision. It shows events firing live—whether they’re from the client, Google Tag Manager (GTM), or server-side.
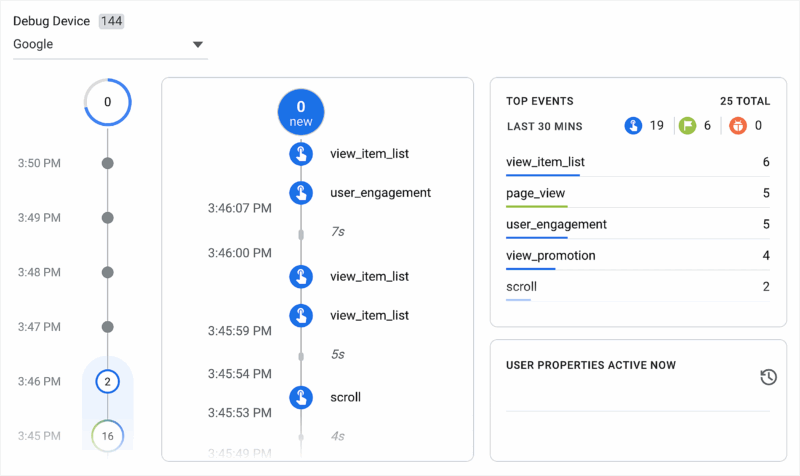
Let’s say you’ve just deployed a new lead form tag via Google Tag Manager, but your conversions aren’t showing up in reports. Head to DebugView, filter by your device, and you’ll see the exact event names and parameters being sent—timestamped and in order.
You’ll also spot issues like:
- Parameters missing or mislabeled: Parameters are the details attached to events, like “button_name” or “form_type.” If a parameter is missing, you lose crucial context. Imagine tracking a click event without knowing which button was clicked. Mislabeled parameters are worse. You might have
btn_namein one place andbuttonNamein another, causing data to fragment or disappear in reports. - Events firing twice: Sometimes a single user action triggers the same event multiple times, skewing your metrics. For example, if a form submission fires twice, your conversion numbers look inflated, making you think more people completed the action than actually did. DebugView helps you quickly catch these duplicates so you can fix the underlying issue.
- Custom dimensions not mapping properly: Custom dimensions give you the power to slice and dice data more precisely, but if they’re not set up correctly—say, the dimension is scoped wrong or the parameter isn’t linked—the data won’t appear where you expect it. DebugView shows you these mismatches in real time, saving you hours of guesswork.
It’s the fastest way to QA new tags, especially on sites with server-side tagging setups where things can break quietly.
Ask your team: When was the last time we actually tested our GA4 events live, end-to-end?
Event-scoped custom dimensions: Track more granular actions
Need to know which button was clicked on a page with multiple CTAs? Or which product variation a user selected before checkout? That’s where event-scoped custom dimensions come in.
For example:
- Add a parameter like
cta_location=hero_bannerorform_type=newsletter_signupto your event. - Register that parameter as a custom dimension scoped to the event.
- Now, you can break down
button_clickevents by where they occurred or what they triggered.
This is especially useful when one event (like click) applies to dozens of elements—but you want to slice the data cleanly in reports.
Ask your team: Are we tracking actions in a way that lets us pinpoint which interaction is actually working?
Attribution settings: Customize lookback windows and model types
GA4 defaults to a data-driven attribution model but you can tailor it to reflect your business reality.
Want to know what first brought someone in? Switch to first-click. Need to align with a longer B2B sales cycle? Extend the lookback window to 90 days.
Example:
- Your paid social team wants credit for view-throughs that drove signups over a two-week period. Adjust the model and window to reflect that.
- Your SEO lead wants to prove organic traffic isn’t just assisting but closing. Set up an exploration with a custom attribution model.
This flexibility is vital when multiple teams want attribution slices that match their KPIs, and it prevents one-size-fits-all reporting that doesn’t tell the full story.
Ask your team: Are we using attribution models that reflect how our users actually convert?
Data import: Stitch CRM or offline sales data for full-funnel attribution
GA4 doesn’t need to stop at web and app data. You can import:
- CRM leads and lead status updates: If a visitor fills out a lead form but only converts into a customer weeks later, importing CRM data helps connect that final sale back to the original visit.
- Offline purchases or subscription upgrades: Say a customer orders over the phone or upgrades a subscription after chatting with support. Importing these offline conversions lets you credit the right marketing channel for driving that business.
- Call center conversions: Phone calls are still huge in many industries. Importing call outcomes into GA4 means you can link calls back to digital touchpoints, getting a fuller picture of your customer journeys.
- NPS survey scores or support CSAT scores: Importing customer satisfaction data lets you see how user experience correlates with behavior and conversions, opening up deeper analysis on what drives loyalty or churn.
By stitching these external data sources back to GA4, you stop relying on siloed systems and start measuring marketing’s true impact across all channels and touchpoints.
Ask your team: What conversions are we tracking outside GA4 that should be stitched in?
BigQuery export: Unleash unsampled, queryable data for advanced modeling
This is where things get properly powerful. BigQuery lets you export all your GA4 data—unsampled, raw, and ready for whatever modeling or queries you need.
You can:
Build lifetime value (LTV) models by joining GA4 sessions with Stripe revenue data
Exporting GA4 data to BigQuery lets you combine behavioral data (sessions, events) with actual revenue figures from payment platforms like Stripe. This means you’re not guessing which users are valuable. Instead, you can calculate exactly how much revenue each customer yields over time. This is crucial for prioritizing marketing spend and understanding which acquisition channels deliver the best long-term return.
Run churn prediction algorithms based on custom behavioral indicators
With BigQuery, you can feed GA4 data into predictive models that spot early signs of churn like declining session frequency, fewer product views, or changes in purchase patterns. Predicting churn before it happens lets your team intervene with targeted retention campaigns, reducing customer loss and boosting revenue.
Create user-level dashboards that combine GA4 with product usage logs or NPS feedback
BigQuery lets you stitch GA4 data with other datasets like product analytics that show feature use or customer satisfaction surveys. Having all this data in one place means you can build dashboards that reveal how user behavior, product engagement, and satisfaction scores connect. This deep insight supports smarter product decisions and marketing strategies.
And because the data in BigQuery is unsampled and raw, you’re getting the full, accurate picture—even with high traffic volumes or long timeframes that GA4 itself can struggle with.
Ask your team: What questions are we struggling to answer in GA4 that we could answer if the data were more flexible?
Enterprise SEO: How to get your reporting back post-UA
With Universal Analytics gone, many SEO teams are feeling adrift. The familiar views, landing page reports, and behavior metrics are harder to find—or just not there. And when you’re working in an enterprise environment with layered content silos, channel-level KPIs, and performance accountability across teams, that’s a big problem.
The good news: GA4 can provide most of your old SEO views—and then some. But you’ll need to rebuild them using custom reports, event-based insights, and dimensions tailored to your site structure.
Here’s how to get your SEO reporting stack back on track and even better, in some ways.
Create SEO-specific custom reports with…
If you’re an SEO lead trying to demonstrate value across organic content types, you need more than just session counts and bounce rates. You need visibility into how organic users behave and which content formats drive the deepest engagement.
Here’s how to build that in GA4:
Organic landing page performance
Start with a simple custom exploration or report in the “Traffic acquisition” section.
- Add a dimension filter for “Session source = google / organic”
- Set “landing page + query string” as your primary dimension
- Track metrics like:
- Users
- Sessions
- Engaged sessions
- Conversions (mapped to soft or hard goals like
form_submit,content_download, etc.)
This view tells you which SEO pages are truly pulling their weight and which ones are bringing in traffic that bounces or fizzles out.
Example: You might find that your highest-traffic blog post drives loads of sessions but barely any engaged sessions or conversions. Meanwhile, a low-volume comparison guide brings in fewer users, but they spend 3× longer on site and convert at 6%.
Ask your team: Are we prioritizing content based on visits or actual business impact?
Scroll depth, engagement rate, CTR equivalents
Bounce rate is gone, but engagement rate is GA4’s new gold standard for content performance. And when paired with scroll depth events, you get a much clearer picture of content quality and UX alignment.
Set up events for:
scroll_25,scroll_50,scroll_75,scroll_90(manually or via GTM)- Combine these with engagement time or
session_engagedflags - Analyze by landing page, content type, or SEO pillar
Example: Your product category pages might get decent rankings, but scroll analysis shows most users bounce before hitting key filters or unique selling propositions (USPs). That’s a design or content issue—not just a ranking problem.
And while GA4 doesn’t track CTR in the traditional sense (since that’s a SERP-side metric), you can build equivalent insights by mapping:
landing_page→ impressions from Search Console (via Data Studio or Looker merge)landing_page→ session start → engaged sessions
This helps you understand which pages earned the click and kept users on site.
Event counts for “SEO win” behaviors
Traffic’s good. But what you really want is action, and GA4’s event-based model lets you track exactly that.
Map out a few SEO-specific “win” events. For example:
internal_link_click→ shows users exploring beyond the first pagecontent_download→ indicates high-value gated or lead-gen contentvideo_playoraccordion_expand→ signals deep engagement
Register these as conversion events or use them to build SEO health dashboards by content group or topic.
Example: Say your TOFU blog post gets 12,000 visits/month but only 250 internal link clicks. After tweaking CTAs and content structure, internal link clicks jump to 1,000, proving your updates moved users further down the funnel.
Ask your team: What soft behaviors signal that organic users are actually engaging, not just landing and leaving?
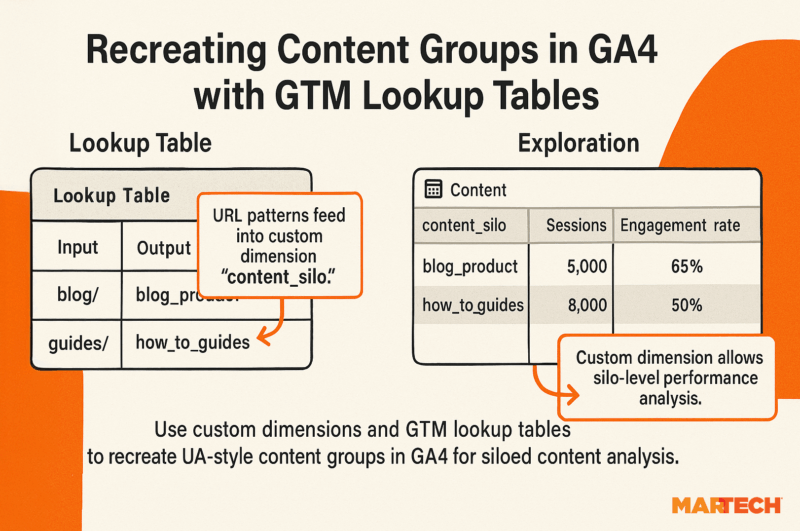
Use content groups or custom dimensions to replicate content silo performance
In UA, content groupings helped you track performance by content theme or type. GA4 doesn’t have this natively, but you can rebuild it with a bit of planning.
You’ve got two main options:
1. Custom dimensions
Set up a custom dimension called content_silo or content_type, and pass values like:
blog_productsupport_docshow_to_guidescase_studybrand_story
You can use a lookup table in GTM to populate these based on URL patterns or page titles.
2. Page path filters in explorations
If your URL structure reflects content silos (/blog/, /docs/, /resources/), use these to group performance in custom reports.
Example: Your /guides/ section might account for just 5% of total organic traffic but contribute to 40% of start_free_trial events. That’s content strategy gold.
By tracking silo performance, you’ll be able to:
- Identify high-performing content themes
- Spot underperforming sections needing refreshes
- Prove content ROI by funnel stage
Track attribution loss
Let’s talk about the big blind spots in GA4 SEO tracking.
You’ve probably noticed:
- Organic sessions seem lower than expected
- Branded search traffic drops without explanation
- Search Console impressions are up, but GA4 visits aren’t as high
This is currently a crucial and often confusing part of SEO reporting, so it helps to expand on the why behind each cause:
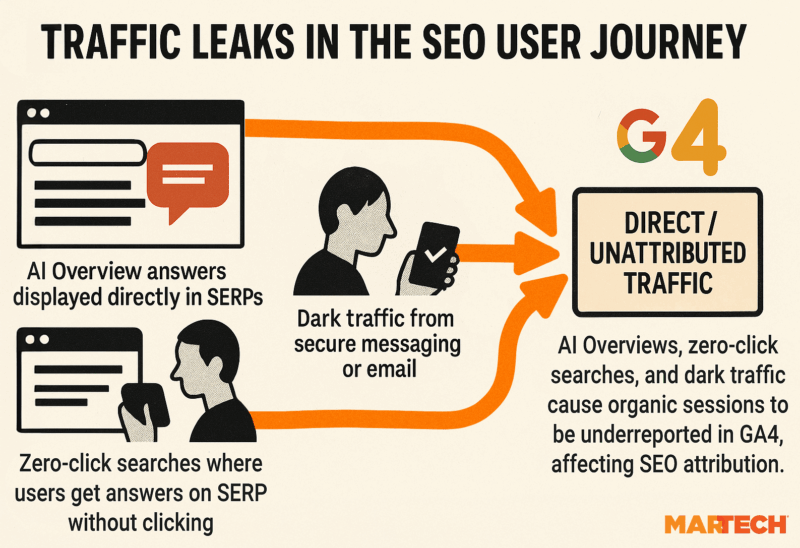
- AI Overviews answer questions directly on Google’s search engine results page, so users get what they need without clicking. That means fewer visits tracked in GA4 even though your brand presence is strong.
- Zero-click searches are similar but more general—people find answers in the SERP features, reducing clicks across the board.
- Dark traffic comes from sources like WhatsApp, email apps, or other secure environments that strip referral data. When users click through directly from these sources, GA4 can’t assign the visit to organic or paid channels, so it lumps them under “Direct,” muddying your attribution.
These distort GA4 attribution, often pushing organic or referral traffic into “Direct.”
What you can do:
- Use Google Search Console and GA4 side by side to monitor mismatches in impressions vs. sessions
- Build modeled traffic estimates by comparing:
- Historical branded traffic trends
- Known drop-off patterns since AI Overview rollouts
- Annotate your reporting dashboards with known Google changes to contextualize shifts
Example: If your brand terms averaged 5,000 organic sessions per month before June 2024 but suddenly dropped to 3,000 organic sessions despite stable rankings, consider modeling the gap and tagging it as “likely lost to AI Overviews.”
You can also reclassify misattributed “Direct” traffic by:
- Comparing landing pages rarely visited directly (e.g.,
/solutions/infrastructure/) - Cross-referencing CRM or lead source data for first-touch attribution
Ask your team: Are we reporting a drop in SEO performance or just a drop in visibility?
GA4 is yours to shape
GA4 can feel like a frustrating leap, especially for enterprise teams used to the structure of UA. But once you move past the defaults, it becomes something far more powerful—an analytics tool you can truly shape around your business. That’s the important shift: GA4 isn’t just another platform your business has to use. It’s a system for how your team measures success, shares insights, and spots opportunities at scale.
If you’re still wrapping your head around GA4’s fundamentals or helping internal teams make the switch, start with Redefine success: Getting started with Google Analytics 4. It’s a useful entry point from Google that walks through core changes, the new event model, and what to focus on first.
But once you’re beyond the basics, this guide is here to help you build a setup that actually serves your business. From custom event design to BigQuery integration, GA4 is only as useful as the strategy behind it. So share this with your data, SEO, and product teams. Ask the tough questions. Use it to reconnect your reporting with what actually matters.
Because the real opportunity isn’t learning GA4. It’s all about building an analytics stack that grows with you.