Long-form video now makes up majority of time watched across all devices
Ooyala says Q1 2017 was the first time long-form video content won the most watch-time across TVs, PCs and mobile devices.

Long-form video content passed a major milestone last quarter, making up the majority of time watched across every screen — connected TVs, computers, tablets and smartphones.
This news probably comes as no surprise to any parent of a teen with a phone, but on the whole, the numbers signal a major shift in how we are consuming video.
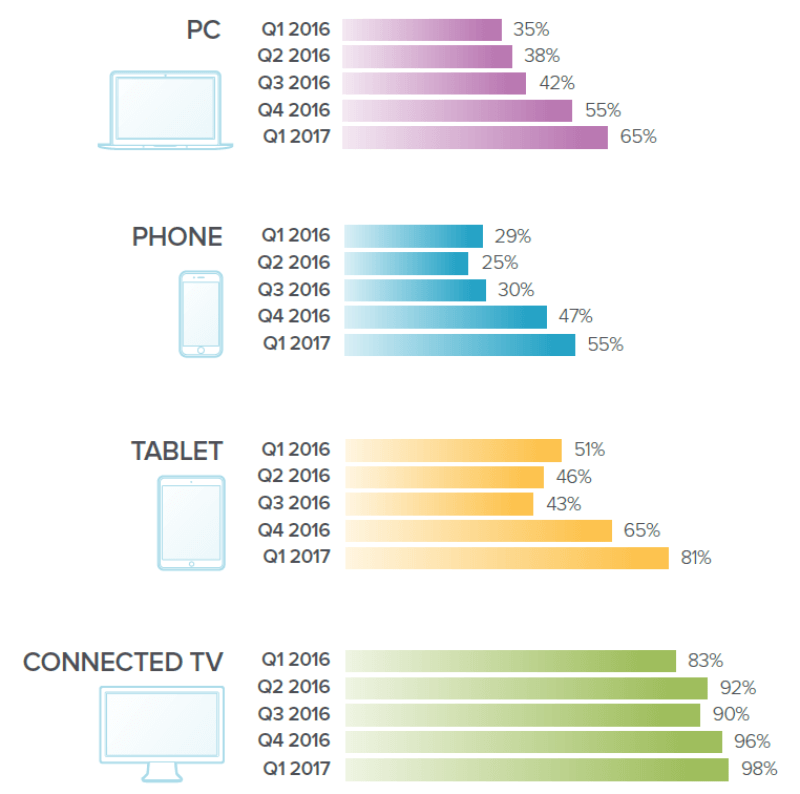
According to Ooyala’s latest video index report, consumption of long-form video consumption was up across the board, with smartphones seeing a jump from 47 percent last year to 55 percent during Q1 2017. PCs were up from 55 percent to 65 percent, and connected TVs up 96 percent to 98 percent.
The most notable increase happened on tablets, with long-from video consumption going from 65 percent in 2016 to 81 percent last quarter.
2016 to 2017 long-form video watch-time trends
Ooyala’s video report is based on data gathered from its more than 500 customers, which, according to the video analytics platform, represent hundreds of millions of online video viewers that span across nearly every country.
“The size of Ooyala video and advertising footprint, along with the variety of our customers, results in a representative view of global consumption and engagement trends,” says Ooyala.
Long-form content wasn’t the only record-breaker during Q1 2017. Mobile devices also set a new high. Ooyala says 56.5 percent of all video plays happened on mobile devices last quarter — up from 47.7 percent in 2016.
From the report:
Smartphones finished the quarter with 46.9 percent of all plays – nearly equaling the total for all mobile devices last year. It was the highest total for smartphones since we began the Video Index, up nearly 20 percent year-over-year … Tablets, too, set a record globally, finishing the quarter with nearly 10 percent of all plays (9.6 percent).
The report also tracked publisher (news and media organizations) and broadcaster (companies distributing TV content) ad completion rates and ad impressions for pre-roll and mid-roll video ads across devices.
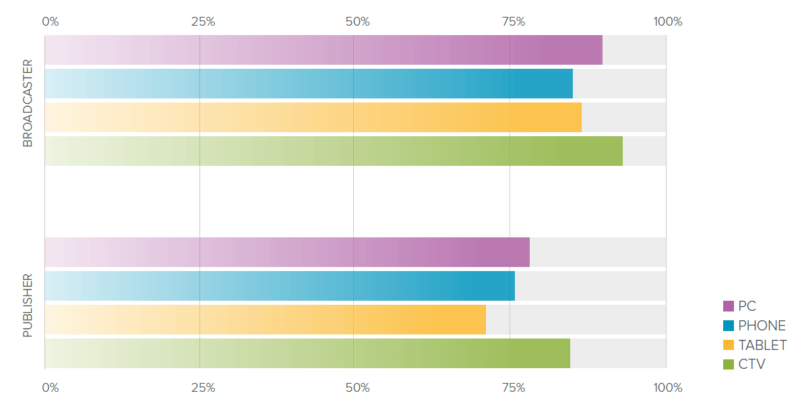
“Broadcasters, with their abundance of premium content, have had enviable numbers as far as pre-roll ad completion in the past, and that didn’t change in Q1,” says Ooyala.
Broadcasters saw a 93 percent pre-roll completion rate on connected TVs, 90 percent on PCs, 86 percent on tablets and 85 percent on smartphones.
Publishers didn’t have as much success — with connected TVs at 85 percent pre-roll ad completion rate, followed by PCs at 78 percent, smartphones at 76 percent and tablets at 71 percent.
Q1 2017 pre-roll ad completion rates by market segment
Mid-roll completion rates were even stronger than pre-roll for broadcasters, with connected TVs seeing 99 percent of mid-roll ads completed, PCs at 97 percent, tablets at 94 percent and phones at 91 percent.
Compared to broadcasters, publishers didn’t see nearly the completion rates for mid-roll ads with PCs at 80 percent and smartphones at 54 percent. (The report didn’t share publisher’s mid-roll completion rates for connected TVs or tablets.)
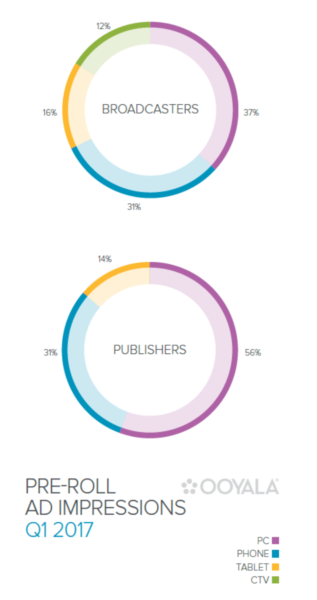
Pre-roll ad impressions for broadcasters during Q1 2017 were split between devices as follows: 37 percent on PCs, 31 percent on phones, 16 percent on tablets and 12 percent connected TVs.
PCs took the biggest share of pre-roll ad impressions for publishers as well, at 56 percent, followed by phones at 31 percent and tablets at 14 percent.
Q1 2017 pre-roll ad impressions
For mid-roll ad impressions, broadcasters saw the most happen on tablets (54 percent), followed by PCs at 27 percent, phones at 12 percent and connected TVs at 8 percent.
Ooyala’s report split publisher mid-roll ad impressions between phones and PCs, with the greatest share (52.5 percent) going to smartphones, and 47.5 percent to PCs.
You can download Ooyala’s full report at: Global Video Index Q1 2017.
Contributing authors are invited to create content for MarTech and are chosen for their expertise and contribution to the martech community. Our contributors work under the oversight of the editorial staff and contributions are checked for quality and relevance to our readers. MarTech is owned by Semrush. Contributor was not asked to make any direct or indirect mentions of Semrush. The opinions they express are their own.
Related stories
New on MarTech
About the author