Infographic: The Periodic Table Of Google Analytics
Want to understand all the ways that Google Analytics can help you learn how people are interacting with your site? A new “periodic table” may prove useful. Created by Jeff Sauer, the table from his company Jeffalytics covers everything from “As” (AdSense Reports) to even stuff Google Analytics can’t report — “Np” for Not Provided. […]
Want to understand all the ways that Google Analytics can help you learn how people are interacting with your site? A new “periodic table” may prove useful.
Created by Jeff Sauer, the table from his company Jeffalytics covers everything from “As” (AdSense Reports) to even stuff Google Analytics can’t report — “Np” for Not Provided.
Here’s a look:
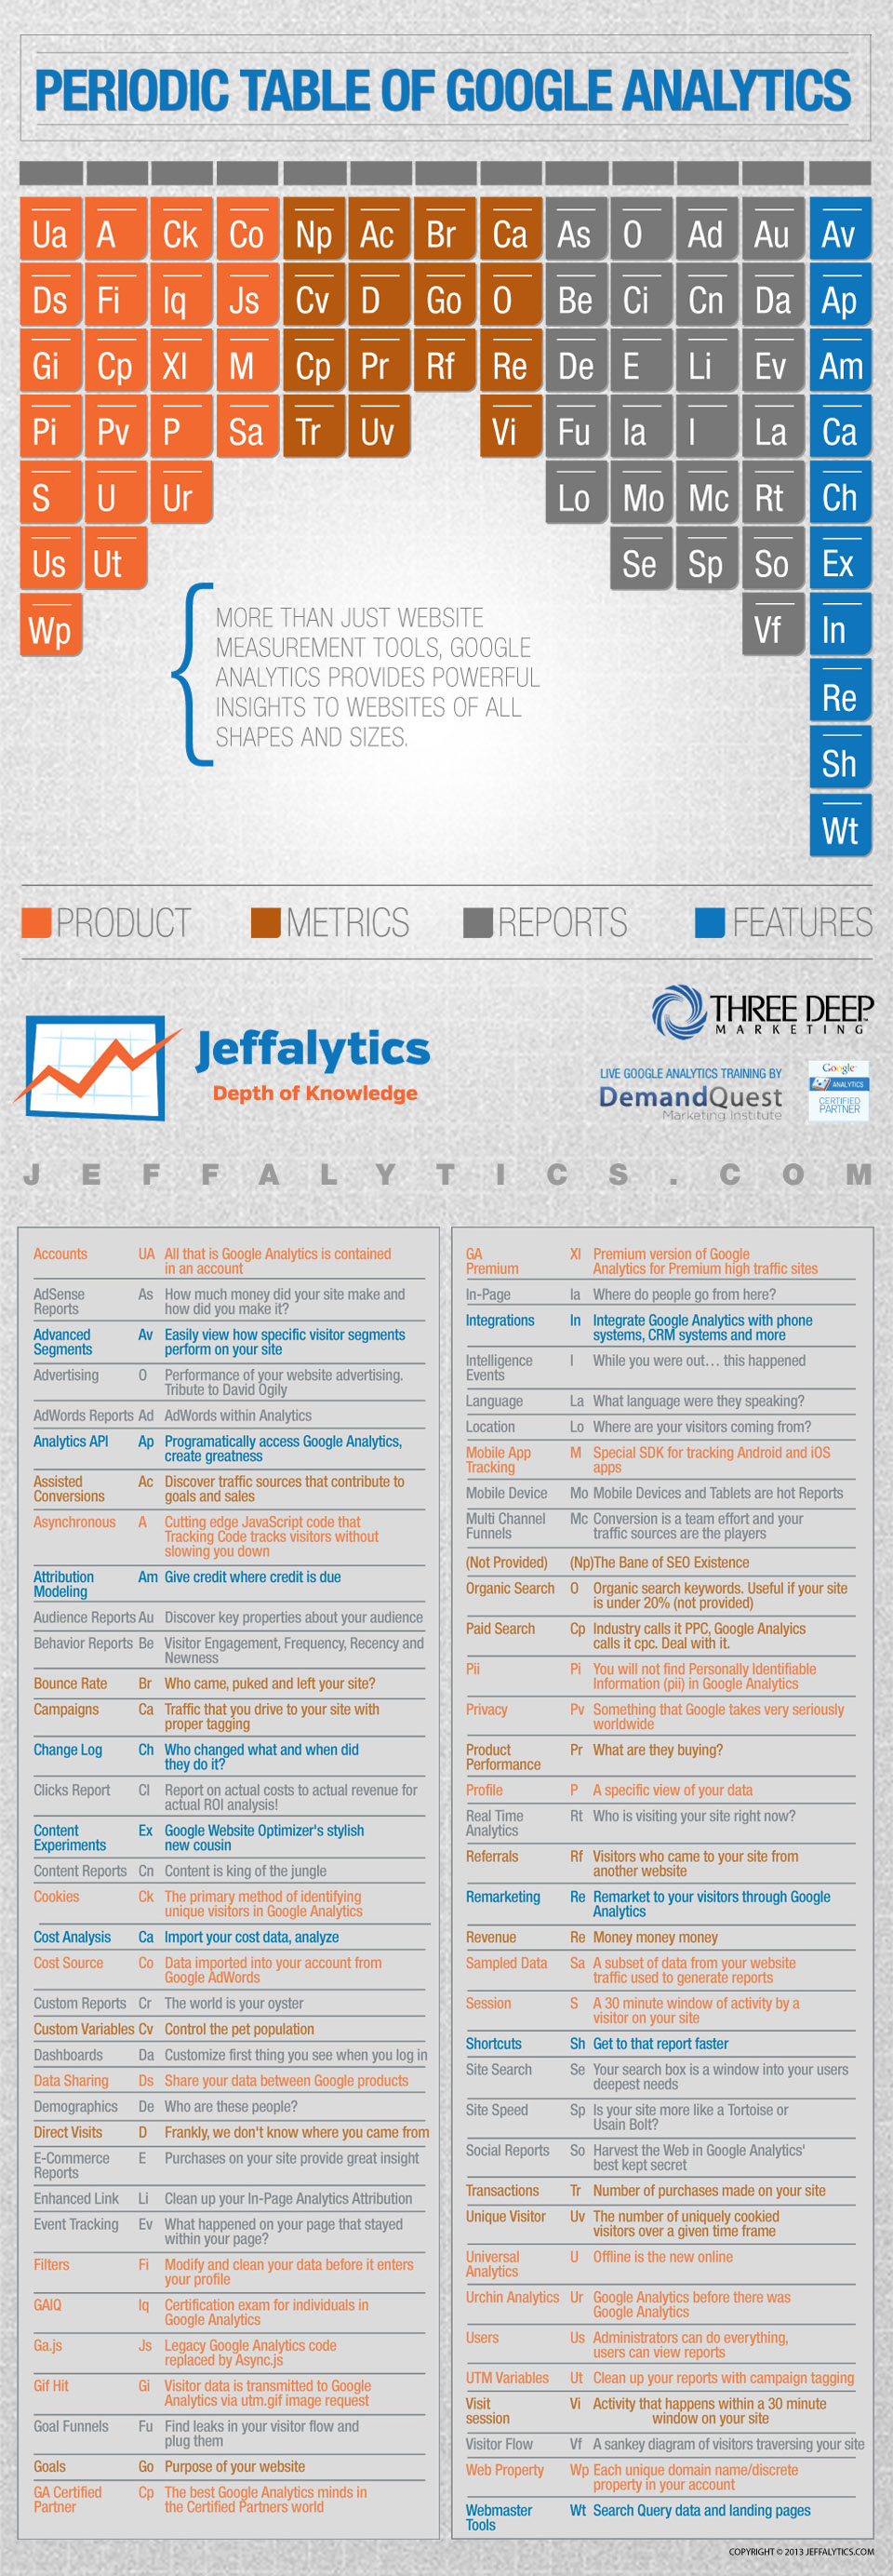
Be sure to visit the actual Periodic Table of Google Analytics page, where you can get a PDF version of the chart to print, embed code to put the chart on your site plus an interactive version that lets you hover over an element to understand more about it.
Related, if you’ve never seen our The Periodic Table Of SEO Ranking Factors, be sure to check that out.
Contributing authors are invited to create content for MarTech and are chosen for their expertise and contribution to the martech community. Our contributors work under the oversight of the editorial staff and contributions are checked for quality and relevance to our readers. MarTech is owned by Semrush. Contributor was not asked to make any direct or indirect mentions of Semrush. The opinions they express are their own.
Related stories
New on MarTech
About the author