12 martech stack infographics to inspire you to enter this year’s Stackies
Join the celebration of visualizations that illustrate companies' martech stacks. Get inspiration for your entry right here.
Our next MarTech Conference, programmed by chiefmartec.com’s Scott Brinker, will take place in April in San Jose, and one of the perennial highlights of the show is the announcement of the winners of the Stackies, aka the Marketing Tech Stack Awards, a contest that highlights the best of the submitted one-slide visual representations of companies’ marketing stacks.
“Going through this process can be a good way to ‘rationalize’ your martech stack,” said Brinker when announcing the opening of the entry form. “The next step, deciding how to visualize your stack, is a chance to step back and think strategically about all these different tools.”
To enter this year’s program, which is sponsored by Lenovo, check out all the info on the site or head directly to the entry form to submit your 16:9 slide before midnight Pacific time on March 15. Besides an opportunity to show off your information visualization skills, it’s a chance to take a closer look at all of the technologies your company is currently using and seeing how they fit together.
But first, check out these 12 submissions from last year’s competition, including the five 2018 winners.
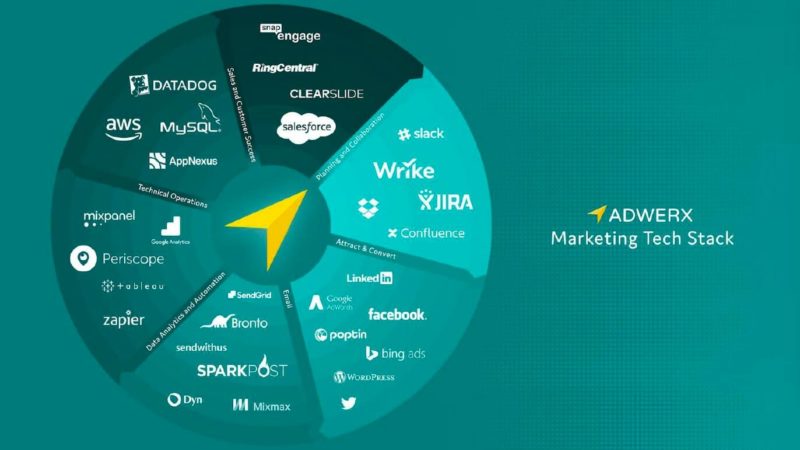
12. Adwerx adapted a fairly traditional pie chart with six different slices
11. Mobly, which helps used car buyers through the purchase process, used an automobile journey metaphor
10. Security software Alert Logic depicted a hacker in front of a screen displaying its technology stack
9. Marketing agency Merkle used a brain to illustrate its intelligent approach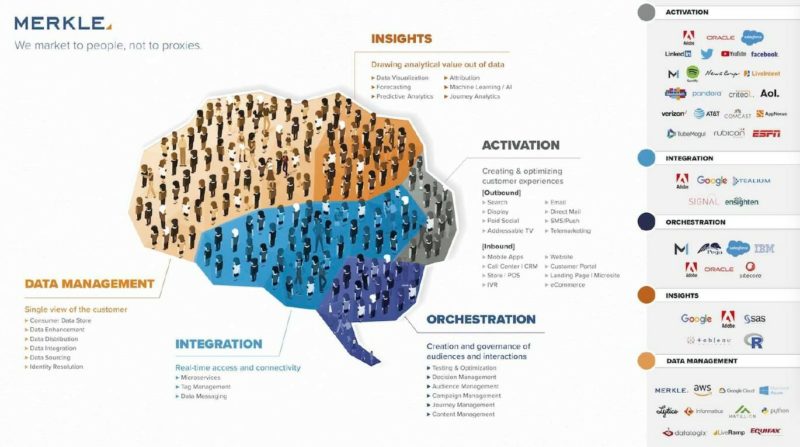
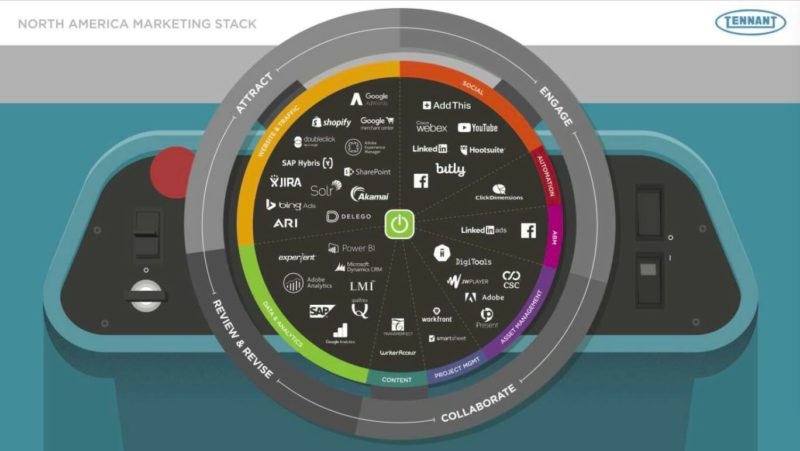
8. Tennant modeled its diagram on one of its floor-cleaning machines.
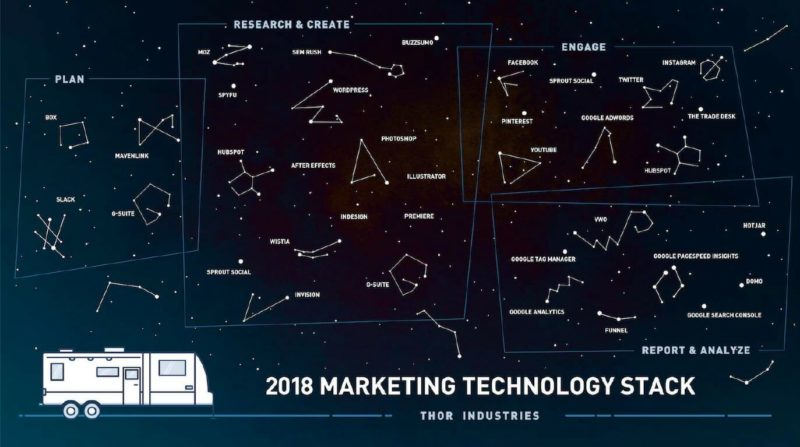
7. Thor Industries, parent of many RV brands, used the night sky, an image that would appeal to its customers
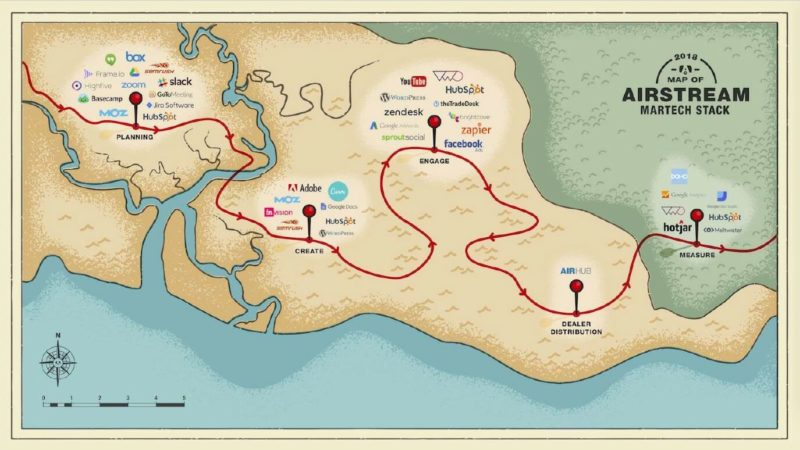
6. Airstream, a Thor Industries subsidiary, chose a map analogy
5. Marketing agency Element Three, the first winner highlighted here, took a lighthearted approach in which movie theater snacks’ size represented their importance
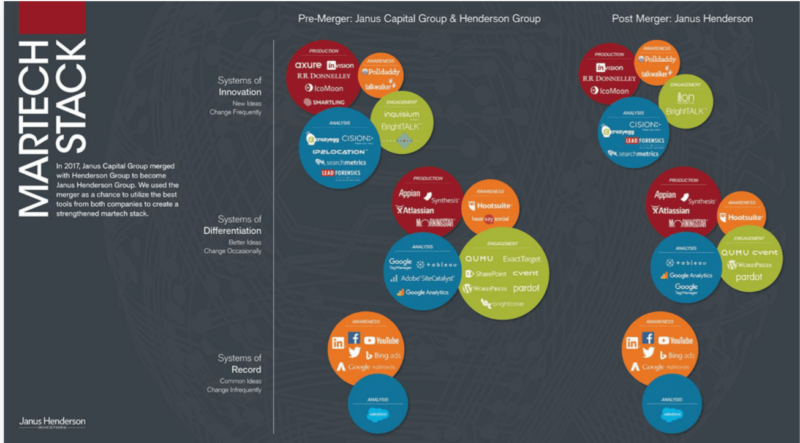
4. Janus Henderson illustrated how its stack changed after a merger
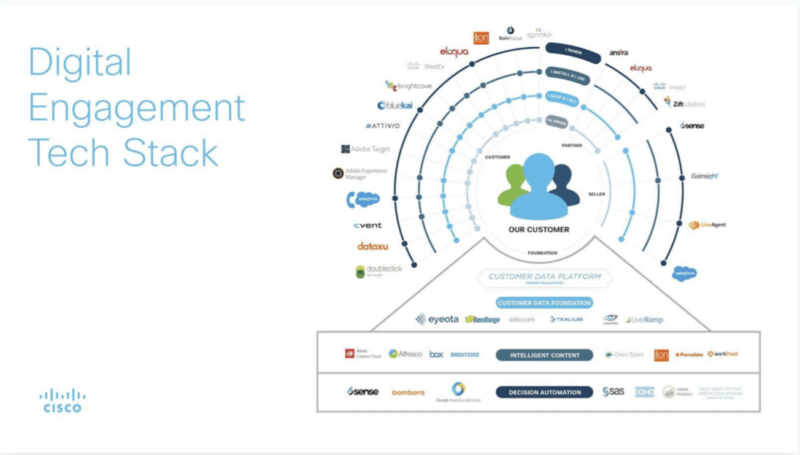
3. Cisco showed off a customer-centric stack, which built on its 2017 entry
2. Earth Networks’ ‘marketological’ illustration is appropriate for a weather data business
Image not available.
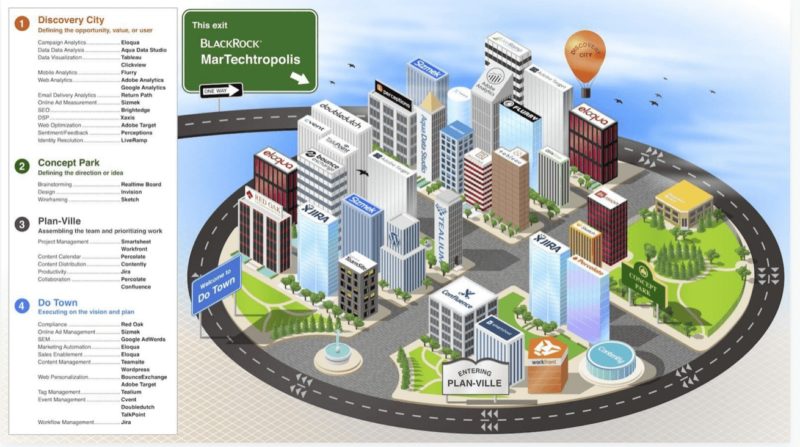
1. Financial planning firm BlackRock showed how it thinks about building its business and growing its customers’ assets
Contributing authors are invited to create content for MarTech and are chosen for their expertise and contribution to the martech community. Our contributors work under the oversight of the editorial staff and contributions are checked for quality and relevance to our readers. MarTech is owned by Semrush. Contributor was not asked to make any direct or indirect mentions of Semrush. The opinions they express are their own.
Related stories
New on MarTech
