Martech: Martech is Marketing Logo
  • Topics
    Transformation
    Operations
    Data
    Experience
    Performance
    Management
    Special Reports
    All Topics
  • Conference
  • Webinars
  • Intelligence Reports
  • White Papers
  • What is MarTech
    Mission
    Team
    Newsletter
    Search Engine Land
    Third Door Media

Processing...Please wait.

MarTech » Marketing Management » Infographic: How Facebook Grew Users & Pages In 2011

Infographic: How Facebook Grew Users & Pages In 2011

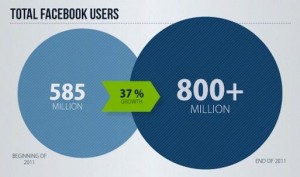
Lots of attention, and debate, on the growth of Google+ this week. It’s a good time to revisit the figures for that other social network you might have heard of, Facebook. It increased users by 37% to 800 million last year, and brands like Coca-Cola and Disney have millions of fans who follow them on […]
Marketing Land Infographics on January 20, 2012 at 12:39 pm

Lots of attention, and debate, on the growth of Google+ this week. It’s a good time to revisit the figures for that other social network you might have heard of, Facebook. It increased users by 37% to 800 million last year, and brands like Coca-Cola and Disney have millions of fans who follow them on Facebook.

These stats and more were compiled into an infographic from SocialBakers:

Want the infographic for yourself? You’ll find it here: Facebook grew 7 users per second all of 2011.

Gathering Stats

Want to track these types of statistics directly? All Facebook has an excellent Facebook Page Leaderboard for tracking the most popular pages (Twitter Counter has a similar Top 100 page for Twitter accounts).

As for Facebook growth, it maintains a statistics page with the latest active user figures it reports, and it issues updates from time-to-time on the Facebook Blog. Here’s a timeline of announcements:

  • August 26, 2008: 100 million
  • January 7, 2009: 150 million
  • April 8, 2009: 200 million
  • July 15, 2009: 250 million
  • September 15, 2009: 300 million
  • December 1, 2009: 350 million
  • February 4, 2009: 400 million
  • July 21, 2010: 500 million
  • July 6, 2011, 750 million
  • Sept. 22, 2012: 800 million (announced during F8 conference)

Keep in mind it’s difficult to compare Facebook figures to Google+ figures, since Facebook reports “active users,” while Google+ does not. These articles have more about that:

  • Why You Can’t Compare Google+ User Figures To Facebook & Twitter
  • No, Google+ Doesn’t Have A 60 Percent Engagement Rate.

Opinions expressed in this article are those of the guest author and not necessarily MarTech. Staff authors are listed here.


New on MarTech

    Marriott launches its own media retail network

    Why marketers have a love-hate relationship with complexity

    If Harry Potter led marketing operations, where would his team sit?

    How a smart email strategy helped Apple Rose Beauty thrive during the pandemic

    Martech firms among 3rd parties scooping email addresses from websites prior to form submission

About The Author

Marketing Land Infographics
Editorially curated infographics with top quality content and information about social media, search, mobile marketing and other stats related to the digital marketing industry. Check out our search marketing infographics at our sister site, Search Engine Land.

Related Topics

Marketing ManagementPerformance Marketing

Get the daily newsletter digital marketers rely on.

Processing...Please wait.

See terms.

ATTEND OUR EVENTS

June 7, 2022: Master Classes

September 28-29, 2022: Fall

Start Discovering Now: Spring

Learn More About Our MarTech Events

June 14-15, 2022: SMX Advanced (virtual)

November 14-15, 2022: SMX Next (virtual)

March 8-9, 2022: Master Classes (virtual)

Learn More About Our SMX Events

Webinars

Data-Driven Answers to Achieve Omnichannel Success

Is Your Marketing Stack Ready for Omnichannel CX?

Outrank in Organic Search with These 5 Core Tactics

See More Webinars

Intelligence Reports

Enterprise SEO Platforms: A Marketer’s Guide

Enterprise Identity Resolution Platforms

Email Marketing Platforms: A Marketer’s Guide

Enterprise Sales Enablement Platforms: A Marketer’s Guide

Enterprise Digital Experience Platforms: A Marketer’s Guide

Enterprise Call Analytics Platforms: A Marketer’s Guide

See More Intelligence Reports

White Papers

Realising the power of virtual events for demand generation

The Progressive Marketer’s Ultimate Events Strategy 2022 Worksheet

CMO Guide: How to Plan Smart and Pivot Fast

The Retail Renaissance Report, USA Edition: 4 Keys to Predicting Online & In-Store Demand Across Global Markets

Thinking Bigger About Marketing Budgets

See More Whitepapers

Receive daily marketing news & analysis.

Processing...Please wait.

Topics

  • Transformation
  • Operations
  • Data
  • Experience
  • Performance
  • Management
  • All Topics
  • Home

Our Events

  • MarTech
  • Search Marketing Expo - SMX

About

  • What is MarTech
  • Contact
  • Privacy
  • Marketing Opportunities
  • Staff

Follow Us

  • Facebook
  • Twitter
  • LinkedIn
  • Newsletters
  • RSS

© 2022 Third Door Media, Inc. All rights reserved.