The Three Layers Of Data And Analytics Success
With the data age well and truly upon us, the struggle to keep up is a challenge faced by virtually every organization. And in a time where the majority of marketers didn’t grow up with iPads or smartphones in hand, these can be difficult waters to navigate. Swimming In Oceans Of Data While everyone seems […]
Spy on Any Website
With the data age well and truly upon us, the struggle to keep up is a challenge faced by virtually every organization. And in a time where the majority of marketers didn’t grow up with iPads or smartphones in hand, these can be difficult waters to navigate.
Swimming In Oceans Of Data
While everyone seems to agree that the sheer volume and expanse of data available today is key to unlocking business value, getting to the point where data is actually driving organization-wide decision-making has proven difficult.
Like a child visiting the beach for the first time, we’ve run down to the sand and jumped into the ocean of data with excitement we could barely contain.
We splashed around in the shallows and even dared to swim a bit deeper — until the first waves knocked us down and held us under, showing us all just how scary and powerful this ocean of data can be.
According to a recent survey of CMOs, this point of running back to the beach is exactly where we are now. Many marketers have recoiled and are actually using data less as they try to figure it all out.
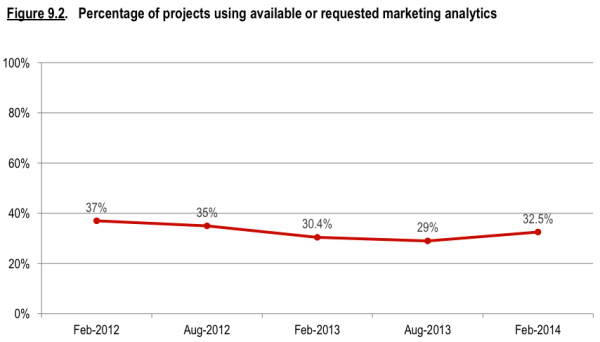
CMO Survey 2014
Marketers have been using data since the dawn of the dollar, and sophisticated data science is nothing new. But what has changed is the amount of data being generated and collected from an ever-growing number of sources and at an ever-increasing rate.
Even if you’ve managed to start collecting data from web, customer, social, search, display, etc., in addition to your myriad-legacy, offline and internal sources, odds are good that you have yet to integrate all this data up and down the full business intelligence stack — and it’s even more likely that there’s a general lack of trust in the data that is being collected.
Many organizations are finding themselves in only the very early stages of visualizing data in ways that provide a holistic view of success or failure and actually help decision makers. Fewer still are using data to answer difficult questions, perform deep analysis, or model the future. Those organizations that have figured out how to unlock the power of their data have all worked through the three layers of data success: technical, business, and strategic.
Technical Success
This may not be the sexiest layer, but it is absolutely the foundation. So often, data collection is simply an afterthought. “I guess we’ll just slap on some JavaScript after we launch our new site” is still commonly heard in planning sessions.
CRM systems are implemented in the vacuum of a siloed solution, apps need to be re-launched with analytics solutions in place only after the first versions have been released, and different members of the same organizations and their agencies remain unaware of what data the others are collecting and how they’re collecting it. It’s no wonder we don’t trust our data!
Governance
Often, the first step to getting the technical layer right is not technical at all, but instead a matter of governance. As the role of data matures within the organization, it requires a clear and coherent strategy to manage across all of the various stakeholders. Simply buying the most expensive tools without the support of senior leadership, without investing in the team that will use it, or without setting clear scope and objectives is just an expensive path to failure.
Try locking your various stakeholders in a room and just whiteboarding the various systems and tools that are collecting data across your organization. Who owns web analytics? How are your agencies sharing digital and media data? How are marketing and IT departments going to work together?
Assigning roles and responsibilities provides the framework for accountability, and establishing an internal Center of Excellence or Digital Analytics Board that represents all of these stakeholders and meets regularly can keep you on track.
Integrating The Data Stack
Once everyone’s on the same page and we know who’s responsible for what, it’s time to look at the full data stack holistically.
This process begins with the explicit mapping of business objectives to the data required to drive the KPIs that will measure success or failure. This will evolve over time into a true measurement framework that layers in business and customer segments and guides structured analysis.
But to enable all of that, we need to make sure we’re collecting the right data in the right ways. This means sketching out your stack and documenting what data is coming from which sources and how these sets will be integrated together.
You may need to visualize reports derived from offline customer data at your brick-and-mortar point of sale, tied together with your call center and back-end CRM as well as your DMP and third-party data sets you’re purchasing, and even your websites and mobile apps.
Mapping out the technologies, tools and solutions is the first step in figuring out the keys between data sets, ETL and data hygiene, efficient data collection and tag management, effective storage, and access to the data sets by the various tools and technology involved.
The technical layer has become much more than copying and pasting JavaScript, and investing in the complexities of today’s data plumbing pays big dividends when it’s time to activate the data.
Recommended Articles
Business Success
Once you have and trust the data you need, it’s time for the business layer, which is simply about getting the right people the right data — in the right format at the right time — to make the right decisions.
An Evolution
Long ago, I remember an analyst coming into my office, frantically explaining how they had sent the wrong report to a client. It was a 150-page PDF of every piece of data we’d been collecting from a few different sources, cleanly laid out on our company letterhead and adorned with the (wrong) client’s logo. I also remember expecting a phone call any minute to fire us for this mistake, but the truth is that the phone call never came.
Why? Because no one ever opened that report. There was zero value in these 150-page PDF data dumps we had been churning out, and we realized that sending out pages and pages of raw data or 50 megabyte Excel files with rows and rows of imported data about click-through rates and time-on-site and conversion rates was the equivalent of telling our clients, “Here, you figure it out.”
The truth is, people care about their organizational and business objectives. I’ve yet to be in a strategy session where someone says, “You know what I’d really like out of our digital marketing efforts this year? A lower bounce rate.”
Speaking The Same Language
Organizations that have leveraged data successfully have found a way to translate the data into the language of the organization. I’ve been asked, “What’s a good conversion rate?” so many times by now that my canned response is nothing more than a subconscious reflex. “Somewhere between 0 and 100 percent.”
What I’ve finally realized is that questions like these are asked out of a desperate attempt to answer the real question: “How on earth does this metric translate to something I actually care about?”
The truth is that we care about things that are bigger than a single metric: sales, leads, profits, growth, efficiencies — the same kinds of things we cared about long before the internet came along. The metrics themselves should be used behind the scenes, contributing to the many KPIs used to measure success or failure against specific business objectives.
Visualizing Data To Gauge Success & Make Decisions
“For my prospects that are in the research phase of product X, what’s the best way to spend my next social marketing dollar to influence moving that prospect down the funnel?”
Unfortunately, that’s not the title of any canned report I’ve ever seen, and what’s clear is that chasing down passwords and logging into a dozen systems, then spending hours sifting through reports and data sets is at the very least an inefficient approach.
Data visualization helps us separate the signal from the noise at the right levels. For example, we can develop scoring systems that take all those raw metrics from those different sources and use them to present clear visualizations that help make decisions at different levels.
Take the simple, high-level table below:
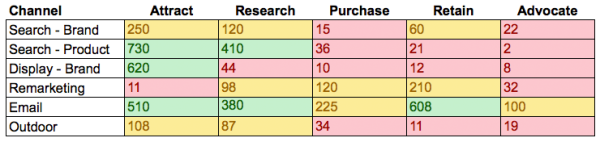
While the underlying data sets and logic may be extremely complex, the end result helps a high-level manager see very clearly where they need to focus their attention this period.
And for those that need to drill down deeper, different visualizations with different levels of granularity can surface specific items equally clearly. Dashboarding tools like Klipfolio or data-visualization tools like Tableau connect to many different data sources, providing clear pictures of whatever it is you need to measure to drive decisions.

We’ve come a long way from the monthly 150-page PDF in your inbox!
Strategic Success
The last layer becomes less about measuring what you’ve done and the immediacy of making today’s decisions, and more about activating your data to plan for tomorrow.
Once again, this layer has existed far longer than the web, but the amount and types of data we’re collecting every second of every day coupled with technological advancements in storage and computing power have given rise to this era of Big Data. The strategic layer relies on both traditional and new twists on data science to answer difficult questions.
Driven By Your Framework
If you’ve gone through the exercise of creating and iterating on a measurement framework, you’ll have a basis on which to prioritize and drive the questions that your data will answer. For each intersection of segments and business objectives, you’ll have a roadmap of learning agendas and necessary analysis plans.
Let’s assume that you’re running an ecommerce division and one group you’ve identified is an online “window shopper” of a particular product line.
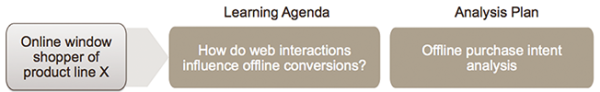
You’ve defined this segment, you’ve built out your reports and dashboards to provide a picture of what they’re doing and even how you’re influencing this group through marketing channels and content; but ultimately, you’re left with a blind spot when the anonymous website visitor steps into the brick and mortar store to finish the purchase.
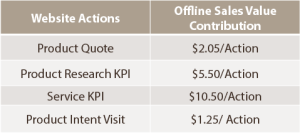
At this point, we can build models that help us understand the connection between online and offline intent, and more importantly, help direct our future efforts towards these high value online actions.
Maybe you’ve noticed that even though your health club is getting more signups than ever before, your annual reports are showing declining revenues. This is a great time to start looking at just how valuable those customers are. What makes a high-value customer and can I predict churn after the first month of membership? Where can I target my marketing dollars to go find not just any new customer, but the right new customer?
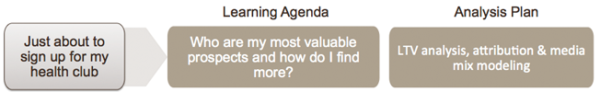
At this point, we can perform value-tier segmentations, lifetime-value analysis, and we can model attribution to help us predict the most efficient channel mix to attract the most desirable prospects.
These are, of course, only two examples, and there are many questions that can be answered with deep analysis, modeling and testing. Guided by a measurement framework, you’ll be able to prioritize the endless questions you have against business opportunity and value, constantly using your data to improve against your goals.
Where To Go From Here?
Unfortunately, there’s no magic balloon ride you can take from the bottom directly to the top of the digital analytics maturity curve. Each layer requires the one before it, so the best next step is to take stock of where you currently are with respect to these layers.
Has your organization laid out clear goals and governance with respect to data and analytics? Are you collecting all the data you need and do you trust its accuracy? If not, there’s likely some work to be done in the technical layer.
Do your stakeholders have reports, dashboards and visualizations that drive their decisions and that they can’t live without? Do you know how you’re trending and improving against clearly-defined organizational goals? If the answer is no, there could be tremendous value hiding in the business layer.
Is there a structured approach to deep analysis and a plan in place with respect to posing and answering high-value and strategic questions throughout the organization? The strategic layer can be your key to unlocking tomorrow’s opportunities.
A Never-Ending Cycle
Last, it’s important to know that your organization — and the world around your organization — is constantly changing and evolving. You inevitably have some IT project going on to consolidate data sources or deploy a new [insert whatever you’ve just bought here].
Business goals will change as a result of your strategic analysis and impact the dashboards and data needed to make decisions. And new technologies will arrive that enable new types and levels of reporting and analysis.
All of this can be overwhelming, but putting everything in a construct of layers and priorities can help. When it comes to leveraging your data to drive your objectives, the table stakes are getting higher, and the answer to the question of “where do we even start?” is often “just start!”
Contributing authors are invited to create content for MarTech and are chosen for their expertise and contribution to the martech community. Our contributors work under the oversight of the editorial staff and contributions are checked for quality and relevance to our readers. MarTech is owned by Semrush. Contributor was not asked to make any direct or indirect mentions of Semrush. The opinions they express are their own.
David Booth is a co-founder and Partner at Cardinal Path, where he helps organizations use data and digital intelligence to gain competitive advantage in their markets. He is an author, adjunct professor, and public speaker, and as a consultant David has worked across five continents helping audiences ranging from C-level executives to technical implementation teams with digital analytics, business intelligence and digital marketing.
View Author ProfileAdd us as a preferred source on Google
Google's "preferred sources" feature allows users to customize their search results by selecting news outlets they want to see more often in the "Top Stories" section.
Add Martech NowRelated Articles

As AI reshapes martech, affiliate programs highlight where human expertise still drives performance and results.
Read MoreMarketing artificial intelligence (AI)
4 minutes readAdobe and Canva are rolling out AI tools that turn design into conversation, intensifying competition and reshaping how marketers create.
Read More
Marketing stacks with too many underused platforms are adding cost, complexity and drag where efficiency was promised.
Read More
Digital experience platform (DXP)
7 minutes readAI is turning digital experience platforms into decision-making engines, and only brands with strong data, architecture and governance will be ready to keep up.
Read MoreRelated Articles
As AI reshapes martech, affiliate programs highlight where human expertise still drives performance and results.
Read MoreMarketing artificial intelligence (AI)
4 minutes readAdobe and Canva are rolling out AI tools that turn design into conversation, intensifying competition and reshaping how marketers create.
Read More
Marketing stacks with too many underused platforms are adding cost, complexity and drag where efficiency was promised.
Read More
Digital experience platform (DXP)
7 minutes readAI is turning digital experience platforms into decision-making engines, and only brands with strong data, architecture and governance will be ready to keep up.
Read More