iOS 9 Content Blocking Reports For Google Analytics
Want to get an idea of how many visitors you're losing to content blocking apps on iOS 9? Columnist Ben Goodsell provides this handy how-to for Google Analytics users.

Last month, Apple launched the new iOS 9 — and with it, support for content blocking applications (e.g., ad blockers) for Apple mobile devices. Many saw this move as escalating the ongoing conflict surrounding ad blockers.
Seth Godin put it most elegantly in a recent post (emphases mine):
[blockquote][I]n the face of a relentless race to the bottom, users are taking control, using a sledgehammer to block them all. It’s not easy to develop a white list, not easy to create an ad blocker that is smart enough to merely block the selfish and annoying ads. And so, just as the default for some advertisers is, “if it’s not against the law and it’s cheap, do it,” the new generation of ad blockers is starting from the place of, “delete all.”[/blockquote]
Furthermore, it’s not just ads that are being blocked by these apps — other types of content, including Google Analytics tracking and other JavaScript-based tagging, are being blocked, as well.
The good news is that there hasn’t been much impact yet, but it’s always good to be prepared as iOS 9 adoption grows. Using Google Analytics, this article attempts to explain how to quickly create reports showing the effect iOS 9 and ad blockers may be having on your site.
Understanding iOS 8 Vs. iOS 9 Adoption
A nice, easy way to visualize the adoption of iOS 9 over time is to leverage Advanced Segments. By simply signing into the relevant Google account and creating segments for iOS 8 and iOS 9 (or clicking those links to import pre-made ones), it’s possible to create a graph like the one below.
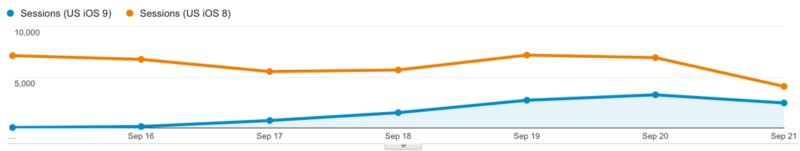
To create segments isolating iOS 8 and iOS 9 traffic in the US, click the “+Add Segment” button in Google Analytics, then click the “+New Segment” button and add parameters as follows. (I named my segments US iOS 8 and US iOS 9.)
US iOS 9:
- Demographics -> Location -> Country -> exactly matches -> United States
- Technology -> Operating System -> Exactly Matches -> iOS
- Technology -> Operating System Version -> starts with -> 9
US iOS 8:
- Repeat Step 1 above
- Repeat Step 2 above
- Technology -> Operating System Version -> starts with -> 8
As you can see in the graph above, it took six days for the adoption to plateau. Eventually, the blue line will take over as iPhone users update to the latest version of iOS.
Now, it’s time to figure out how many of those dang Millennials are blocking our ads (or in this case, Analytics tracking)!
Finding Sessions Lost To Ad Blockers
To understand the slightly more complex problem of whether iOS visits have been lost to content blockers, here are two possible solutions.
Compare iOS And Android In Google Analytics
Comparing daily percent change for both iOS and Android in Google Analytics is one way to help determine if the effect of content blockers is significant enough to notice a difference.
To do this, build a Custom Report using the instructions below (or import this pre-made iOS vs Android custom report).
From the “Customization” tab in Google Analytics, click the button for “+New Custom Report” and use the following parameters:
- Type: Flat Table
- Dimensions: Date (Time), Day of Week (Time), and Operating System (Users)
- Metrics: Sessions (Users)
- Filters: Include -> Operating System (Users) -> Regex -> iOS|Android
- Save
Consider using a wide date range (maybe year to date) for historical perspective. Export the data to a CSV file so that you can use it in Excel (or preferred tool).
Add Metrics Using Excel
Once the data is downloaded to your machine, open in Excel (or preferred tool), filter for iOS vs. Android, sort date by ascending, then add a Daily % Difference column using the Percent Change formula =(new-old)/old.
Note: An example spreadsheet containing the formulas and charts can be downloaded here.

By filtering for each day of the week and iOS vs. Android, it’s possible to add an additional Daily % WoW ∆ (delta) column. This can help us gain historical perspective on the past to understand if the trend we’re seeing is really substantial.

The result should look something like this.

Create Charts Using Excel
Once the data has been populated, it’s easy to begin creating charts (see example spreadsheet).
This site recently experienced a big jump. But it was seen for both Android and iOS. If we they were losing traffic from iOS ad blockers, we’d expect to see a decline over time, specific to iOS and not Android. It’d be best to confirm by looking at a wider date range, or pulling some averages.
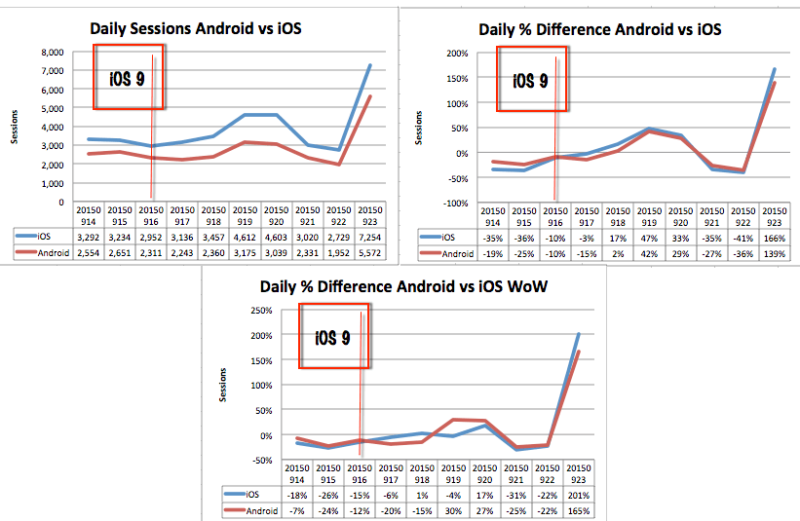
Because we pulled the Day of Week metric, it’s possible to get a good historical perspective on Sessions and the % Change metrics we added to the spreadsheet.
Below, we’re certainly seeing some strange recent trends that may be worth investigating further. Again, particularly in the % Change views, iOS would be in the negative more than Android if there were a noticeable effect from Ad Blockers.
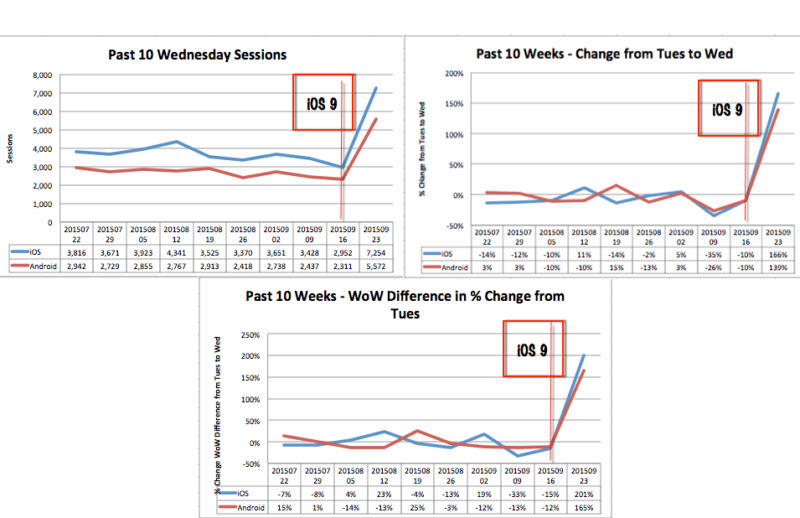
Consider creating these reports and pulling on a weekly basis to help confirm suspicions of potential loss.
Conclusion
Ad blockers have been around for a while (on Android and via desktop browser extensions) and have just now has been introduced into the world of Apple. As the adoption of iOS 9 increases, so also does the chance of customers disappearing from Analytics.
I hope this article can be a good starting point to creating your own analysis of this and other issues. It’s possible that comparing iOS vs. Android might not work for your site. As an alternative to comparing Android and iOS metrics in Analytics, it may be possible to pull hits from iOS user-agents out of Log Files, then compare with the iOS Page Views you see in Analytics.
Do you already have, or can you think of a better way to attribute a loss to Ad Blocking?
Opinions expressed in this article are those of the guest author and not necessarily MarTech. Staff authors are listed here.
Related stories
About the author