IAB says digital ad revenues up 21% to $88B in 2017. Left unsaid: The duopoly dominated that growth
Mobile grew 36 percent year over year to $49.9 billion, accounting for 57 percent of overall digital ad revenues in the US.
Spy on Any Website
![]()
The IAB (Interactive Advertising Bureau) is out with its Q4 and 2017 year-end state of the digital advertising industry report. In a repeat of the past several years, digital advertising revenue is up. There was growth across formats and devices. And while the IAB doesn’t name names, Facebook and Google continue to suck up most of the oxygen in the room.
The data for the IAB report is collected from IAB member companies and publicly available corporate data by PwC.
Overall, digital ad revenue grew 21.4 percent to $88 billion in 2017. To put that in perspective, PwC says the revenue change in digital seen last year is greater than in the newspaper industry as a whole.

Digital video increased overall share in 2017, chipping away at search, to $11.9 billion, up 33 percent from $8.9 billion in 2016. Search still continued to grow at 17.5 percent in 2017, to $40.6 billion. Banner revenues, which includes banners, sponsorships and rich media, totaled $27.5 billion in 2017, up 23 percent from 2016.
Mobile continues to gain share, accounting for 57 percent of the overall digital ad pie in 2017, to reach $49.9 billion. That’s more than all digital ad revenues in 2014. Mobile has seen a compound annual growth rate (CAGR) of 71.4 percent since 2010. Mobile share grew across all formats, as shown in the slide from the IAB webinar on the report.

Despite mobile’s ascendance, desktop revenues still grew in 2017, with a CAGR of 6 percent over 2016.
CPMs also increased in 2017, according to data from SQAD.com shared by the IAB. CPMs for in-stream video were up 3 percent 2017 year over year to $25.22, and CPMs for display rose 6 percent to $14.72 on average.
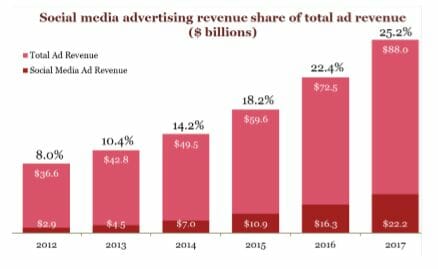
Social media isn’t broken out as a format, but its share of revenue topped 25.2 percent in 2017, reaching $22.2 billion. Facebook, of course, accounts for the bulk of social media advertising spend in the US.
Duopoly dominance
The IAB doesn’t release data on specific companies, but the top 10 companies commandeered 74 percent of total revenues. That share among the top 10 has remained relatively consistent, says the IAB. The elephant in the room is the fact that the top two — Facebook and Google — now make up the majority of that 74 percent.
During the webinar announcing the IAB report, Brian Wieser of Pivotal Research shared his analysis of Google and Facebook’s share of the market in the US. Acknowledging there are “a lot of assumptions” that go into these estimates and that his analysis is based on gross revenue, Wieser said, “It seems clear they are taking share. [Google and Facebook] probably accounted for 90 percent of the growth. The rest probably accounted for 10 percent or so.” Weiser pegs the duopoly’s share of US ad revenues at above 70 percent.
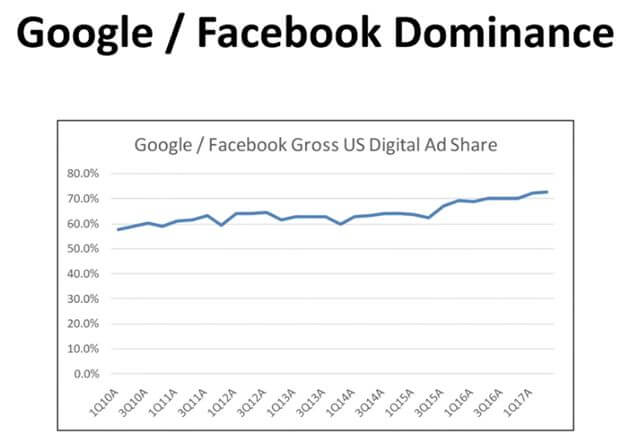
Source: Pivotal Research analysis, Company Reports, IAB
The full report is available for download here.
Contributing authors are invited to create content for MarTech and are chosen for their expertise and contribution to the martech community. Our contributors work under the oversight of the editorial staff and contributions are checked for quality and relevance to our readers. MarTech is owned by Semrush. Contributor was not asked to make any direct or indirect mentions of Semrush. The opinions they express are their own.
Ginny Marvin was formerly Third Door Media’s Editor-in-Chief, running the day-to-day editorial operations across all publications and overseeing paid media coverage. Ginny Marvin wrote about paid digital advertising and analytics news and trends for Search Engine Land, Marketing Land and MarTech Today. With more than 15 years of marketing experience, Ginny has held both in-house and agency management positions. She can be found on Twitter as @ginnymarvin.
View Author ProfileAdd us as a preferred source on Google
Google's "preferred sources" feature allows users to customize their search results by selecting news outlets they want to see more often in the "Top Stories" section.
Add Martech NowRelated Articles

New research found marketers invest in targeting, AI, and creative while neglecting the post-click experiences they say drive paid media ROI.
Read More
Free tools have lowered the cost of marketing mix modeling, but data quality and human expertise remain the biggest barriers to success.
Read More
IAB Tech Lab's proposed SupplyChain v1.1 update could give advertisers a clearer view of every company that touches a programmatic bid request.
Read More
Build a repeatable system for creative experimentation using pre-vetted freelancers, modular briefs, and automated workflows.
Read MoreRelated Articles
New research found marketers invest in targeting, AI, and creative while neglecting the post-click experiences they say drive paid media ROI.
Read More
Free tools have lowered the cost of marketing mix modeling, but data quality and human expertise remain the biggest barriers to success.
Read More
IAB Tech Lab's proposed SupplyChain v1.1 update could give advertisers a clearer view of every company that touches a programmatic bid request.
Read More
Build a repeatable system for creative experimentation using pre-vetted freelancers, modular briefs, and automated workflows.
Read More