Using Data.gov And Open Data To Develop Actionable Consumer Insights
Columnist Benjamin Spiegel explains how data.gov goes beyond traditional digital research data to bring you actionable marketing insights.
Spy on Any Website
 As more and more of the world’s content is being digitized, refreshed and “remastered,” a big part of that movement is the digitization of government data. In 2009, the federal government launched data.gov, a platform for open, machine-readable digital data sets.
The site, managed and hosted by the US General Services Administration, Office of Citizen Services and Innovative Technologies, describes itself as:
[blockquote] The home of the U.S. Government’s open data: Here you will find data, tools, and resources to conduct research, develop web and mobile applications, design data visualizations, and more.[/blockquote]
Various cities, counties and states also have their own sites like data.seattle.gov or data.ohouston.org.
To simplify, data.gov and its child sites provide automated and often structured access to more than 191,500 sets of government data, available on the national or local level. Most states have different depths and levels of data available, but the collection and availability are constantly growing.
The data covers a variety of topics, with the most popular being:
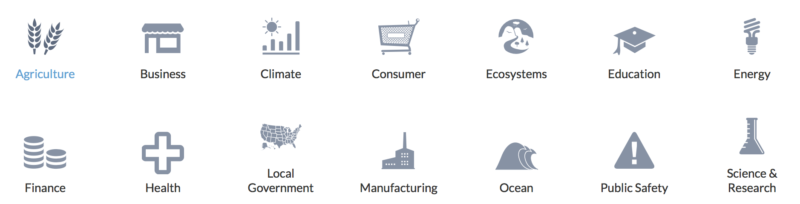
While in the past, I could not always find a purposeful marketing application for the data, my perspective and approach have changed since: a) the site started including a wider range of sectors; and b) it began to shift away from more local aspects of the data sets to focus more on the business questions and personas they address.
Gleaning Insights From Data.gov
People often try to compare data.gov to Google Trends or other broader data sets like Twitter Trends, but it’s not that at all. Instead, the data provided at data.gov are very specialized, with a specific focus on government entities and responsibilities.
This makes it very different to work with; you often have to look at the data through a special lens to find their value and purpose.
For example, there is a database which, on the surface, is all liquor license applications; if you look at it differently, it becomes a hyperlocal database of where there are going to be new nightclub and restaurant openings.
Today, I want to share a real-world example of how we have used these data in the past to create actionable consumer insights for our clients.
One of our financial clients was trying to grow its client base through campaigns that addressed consumers’ pain points around their current (competing) financial institution. But how do you determine what those pain points are?
Our minds jumped immediately to search, forums and social as potential sources of data, but for our purposes, they were not very reliable, for a few reasons:
- Social data lack depth when compared to the granular information we needed (region, product, issue and so forth). The search data provided some signals, but not enough to justify a multi-million-dollar campaign.
- Social data often comprise personal venting rather than serious concerns.
Given the banking consumers’ average age, we expected to find them on social media — but we did not see many of them complaining about their mortgage or savings accounts on Twitter.
However, on data.gov, we found a dataset from the CFPB (Consumer Financial Protection Bureau) that contained more than 500,000 official complaints filed with the government about financial institutions.
In my opinion, these carry much more weight than someone venting on social media or in a blog post.
This data are also extremely rich. They not only contain just the company, but also the product, sub-product, actual issue, location, the company response and the response time. This multi-level granularity allows for some significant insights and specificity.
The first metrics we looked at were the number of complaints by product and company.

The overall number is obviously relative to the number of each institution’s customers, but this gives us an idea of which products are the main pain points by bank. Once we identified the areas of pain we wanted to leverage, we started looking at the actual issues.
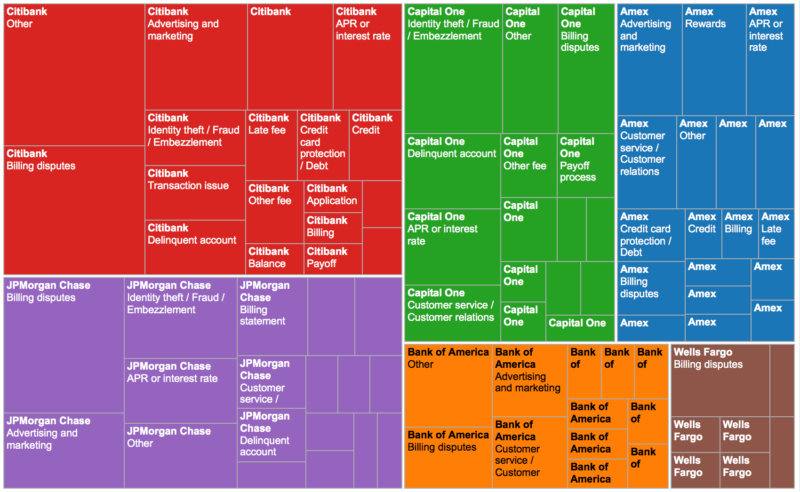
The above map shows us the actual issues related to our main competitors’ credit card products. Although there are some common issues across all companies (like billing disputes), several clear, distinct opportunities (issues) stand out — for example, complaints about advertising claims on Amex cards and frequent identity theft issues for Capital One cardholders.
All of these are great human insights we could leverage in our campaigns to gain a competitive edge.
Zeroing In On The Details
What makes the data really actionable is their level of detail. Having ZIP code-level data ensured that we addressed the correct issues state by state (they do differ), and the dates of the complaints identified which problems were continual instead of one-time occurrences.
I created these visuals by downloading the raw CSV files from data.gov and importing them into Tableau. However, data.gov has some nice online tools that let you manipulate, search and visualize the data right in the browser.
That said, there are hundreds of ways we can visualize and slice and dice the data to answer real-world business questions.
As you can see, data.gov is very different from traditional digital research data such as social media conversation or search query data; I hope the example above started some ideas on how some of the data could yield actionable insights for your brand’s marketing.
With nearly 200,000 distinct data sets across multiple industries and entities, marketers can have a field day tying back the open data to real-world consumer desires, activities and insights in new ways.
Contributing authors are invited to create content for MarTech and are chosen for their expertise and contribution to the martech community. Our contributors work under the oversight of the editorial staff and contributions are checked for quality and relevance to our readers. MarTech is owned by Semrush. Contributor was not asked to make any direct or indirect mentions of Semrush. The opinions they express are their own.
Benjamin Spiegel, Chief Digital Officer, Global P&G Beauty, has nearly 20 years of experience in the technology, advertising and marketing industries. He is known as an innovator, leading the development of strategic solutions that combine data, media, insights and creativity to create disruptive digital solutions that transform brands and businesses. Prior to joining P&G as Chief Digital Officer, Global P&G Beauty, he led the search practice across the GroupM agencies, the P&G business for Catalyst, and most recently served as CEO of MMI Agency. In his current role, Benjamin brings to P&G Beauty his digital expertise, leadership and passion for creating and building leading digital capabilities. He is known as an industry thought-leader. As such, he is a frequent contributor to and speaker at conferences around the world.
View Author ProfileAdd us as a preferred source on Google
Google's "preferred sources" feature allows users to customize their search results by selecting news outlets they want to see more often in the "Top Stories" section.
Add Martech NowRelated Articles

CMOs are spending more on digital media and acquisition as consumers grow more skeptical of AI-generated content and its value.
Read More
Vibe coding can replace SaaS tools fast, but risks in security, integration and maintenance can quickly outweigh the savings.
Read More
As AI reshapes martech, affiliate programs highlight where human expertise still drives performance and results.
Read MoreMarketing artificial intelligence (AI)
4 minutes readAdobe and Canva are rolling out AI tools that turn design into conversation, intensifying competition and reshaping how marketers create.
Read MoreRelated Articles
CMOs are spending more on digital media and acquisition as consumers grow more skeptical of AI-generated content and its value.
Read More
Vibe coding can replace SaaS tools fast, but risks in security, integration and maintenance can quickly outweigh the savings.
Read More
As AI reshapes martech, affiliate programs highlight where human expertise still drives performance and results.
Read MoreMarketing artificial intelligence (AI)
4 minutes readAdobe and Canva are rolling out AI tools that turn design into conversation, intensifying competition and reshaping how marketers create.
Read More