Be A Statistically Significant Marketer (Part 2)
Do you really have enough data, or the right data, to make a decision? Learn how to calculate statistical significance.
Spy on Any Website

Yay, statistics!
Last month we had some fun exploring the two questions that every digital marketer should be asking about everything they do:
- Question 1: Are the results I’m seeing from my online marketing really telling me what happened?
- Question 2: Are these results “good” enough to predict what will happen in the future?
When we know how to answer these two questions, we become the Oracles of Delphi within our businesses, interpreting the past and predicting the future of our online endeavors.
To illustrate the application of this amazing power, we drew from three example scenarios.
Scenario One: The Failing Email List
Prim just sent out the monthly email to her company prospect list of 3,000 people. Last month, she got 31 inquiries from the email. This month, however, she only got 20.
Sales is complaining about the low number of leads. She’s feeling the heat.
What happened? Has Prim’s email list finally been tapped out?
And what will she tell her boss?
Scenario Two: The Supercharged Landing Page
Duke’s landing page gets 20,000 visits each month like clockwork. From this traffic flow, it has been delivering 350 leads for his business each month.
One day, Duke stumbled across this column and decided he could open the sales spigot even wider by trying some of my ideas.
He made some tweaks to his landing page and re-launched it.
Shazam! He got 200 leads in first fifteen days of the month. At this rate, he’ll get 400 leads this month, one of the biggest months ever.
Duke has found a winner for sure! Or has he?
Recommended Articles

Scenario Three: The 95% Confidence Split Test
Trey completed a split test and one of his treatments has reached a magical level of confidence over 95%. The test reports a 23.49% lift in conversions! That’s big.
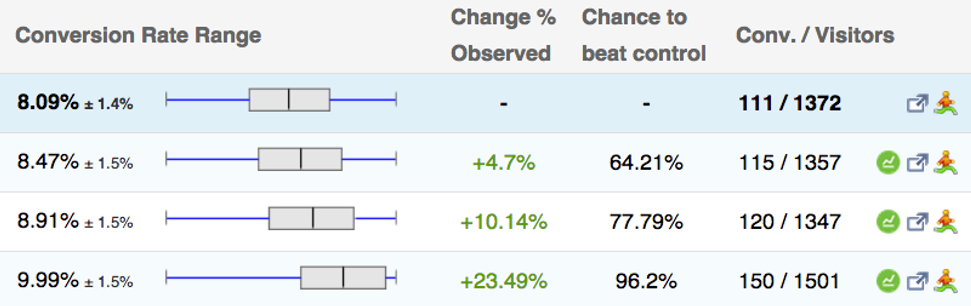
Figure 1: The results of Trey’s split test with one control and three treatments.
Trey boldly made the changes permanent on the site, and then…
Crickets. No big change in his orders or revenue from the previous period.
What happened? Why will Trey’s boss’s boss have to tell his wife he’s not a winner?
Last time, we determined if the data provided in these three scenarios were accurate reflections of what actually happened. Now, we’ll look at how to make decisions based on the confidence we calculated.
If you haven’t read last month’s column, go ahead and do that now. We’ll wait for you.
The Burning Question: What Do I Do Next?
As a digital Oracle (the Greek mythology kind, not the Ellison mythology kind), those in our business come to us with pleading looks in their eyes asking what the future might hold for them. Some of these people are our bosses, and they look more displeased than pleading.
What do we tell them? Let’s look at our scenarios.
The burning question posed to Prim would be, “OMG, is our email list drying out? Will we get fewer inquiries if we continue to send to them?”
Last month, Prim’s email garnered 31 conversions for a conversion rate of 1.0%. This month, it was 20 for a conversion rate of only 0.7%. Because Prim has a short, fat bell curve of possible conversion rates, a 0.7% conversion rate should not be a surprise.
Prim’s question is this: Is 0.7% my new conversion rate? Is this what I will see if I send the email again. Statistically, the answer is, “No.”
Let’s turn again to our A/B Test Calculator from Online Dialogue.
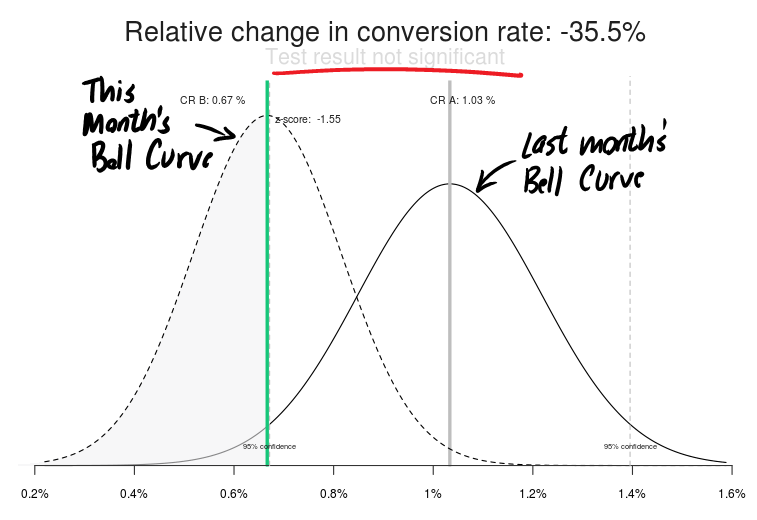
Figure 2: The bell curves for Prim’s two most recent emailings.
Statically, Prim’s drop in conversion rate isn’t significant.
Because the two bell curves overlap significantly, there’s little confidence that she’ll see another email that delivers 20 inquiries. Her response to her boss should be, “Yes, it’s less that last month, but within the expected range of results. We should keep sending to this list.”
There are some caveats. The content of the emails changes from send to send, as does the subject line. These variables make it harder for Prim to predict the future. What may be more interesting is to combine the results of multiple emails over time. This provides a larger sample of conversions to work with, and the changes in content get averaged out somewhat.
Over two months, Prim has a conversion rate of 51/3000, or about 2%. If we look at her bell curve, we find out that we can expect a conversion rate of between 1.2% and 2.2% over the next two months, or between 36 and 66 inquiries.
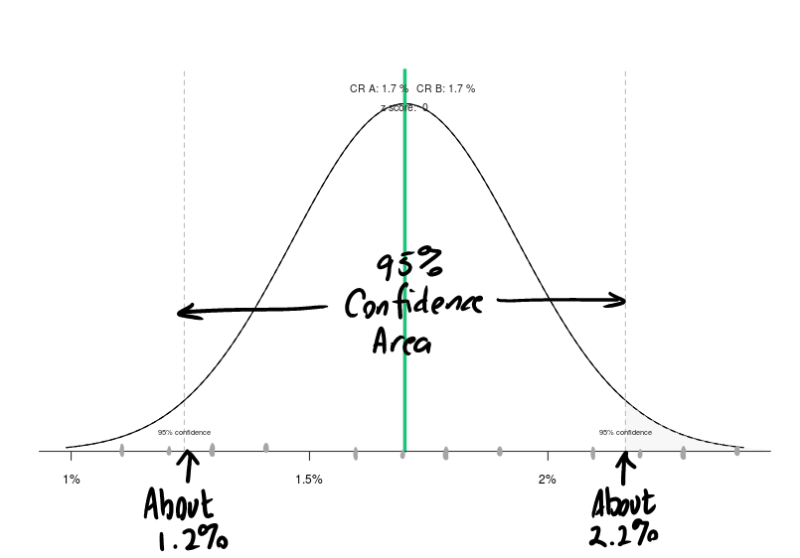
Figure 3: With 51 inquiries from her two mailings, Prim can predict her conversion rate for the next two.
Prim’s sample is different from Duke’s and Trey’s in that she is mailing to her entire population. Duke and Trey are dealing with a sample of the entire population that may come to their pages. If she limited her analysis only to those recipients who opened the email, she would be measuring a sample of her population. Open rates are not reliable, in my opinion.
Should Duke Run Out & Buy An Expensive Car?
Things seem to be looking up for Duke. His conversion rate for the first half of this month has moved from 1.75% to 2.0%, an upswing of 14.3%. If this keeps up, he’ll have one of his biggest months.
So, will this keep up? The answer is, “No.” Entering his last month’s results (350 sales on 20,000 visits) against this month’s results to date (200 sales on 10,000 visits), we get the following two curves:
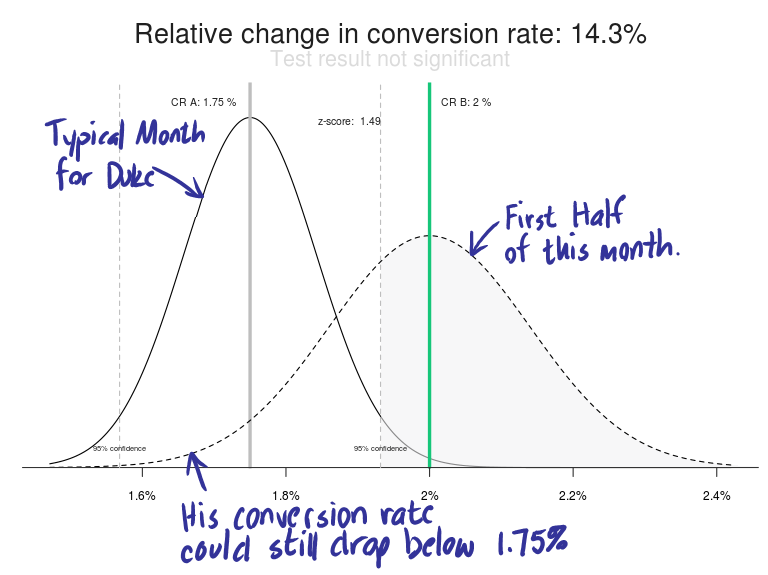
Figure 4: The bell curves for Duke’s previous month and his most recent half month.
Duke’s new bell curve is fatter and shorter because the sample size is much smaller than a full month.
As a result, both curves break below his “tried and true” conversion rate of 1.75%. There is still time for his results to turn enough to give him one of his worst months. Don’t buy any new cars yet, Duke.
Has Trey Found A New Control?
While Prim and Duke are not running A/B split tests, Trey is. Prim and Duke are analyzing month-over-month data, meaning they are not controlling for time. Things this month may be different than last month. A competitor may launch a new product. The stock market may be down. Business people may be taking vacation.
Trey is running a true split test, which compares a control to one or more treatments for the same time period. This increases our confidence that time-based changes aren’t influencing the results.
Trey is certainly using a split-testing tool such as Optimizely, Visual Website Optimizer, Convert.com or Adobe Test and Target to manage his test.
How is he doing? The tool told him that he found a new control. It reports a 96.2% confidence that one of his treatments will deliver a conversion rate increase of 23.5%. Here’s what the result looks like in our A/B Split Test Calculator:
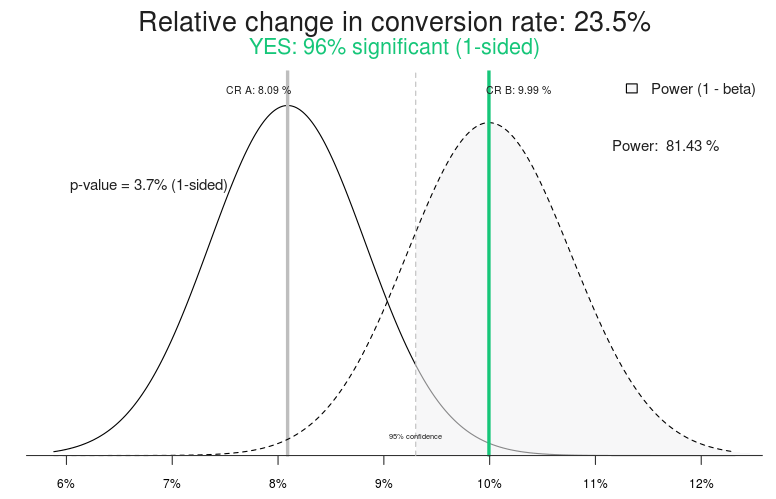
Figure 5: Trey’s split test seems to have discovered a winner.
So, why didn’t he see a lift in sales when he launched the new treatment?
This is the data provided by the split test calculator comparing the control and the last treatment in Trey’s test.

Figure 6: Fancy-sounding numbers reported by the A/B Split Testing Calculator.
The conversion rates and the relative change in CR (conversion rate) are self-explanatory. But, what is “Effect size”?
When we’re dealing with bell curves, everything is divvied up by standard deviations. The higher the standard deviation, the more deviant the data is. By deviant, we mean more likely to lie to us.
When comparing a control to a treatment, the control is most important, so the effect size is based on the standard deviation of the control.
In this case, the standard deviation is about 0.73 percentage points. Multiply this by the effect size of 2.6 and we get 1.9%. This is the difference between the conversion rate of the treatment (9.99%) and the control (8.09%).
In short, Effect size is a standardized way of determining how big of a change we’re talking about. If Trey had larger samples, his standard deviation would be smaller and the effect size would be larger, even with the same conversion rates.
Higher effect size means more confidence in the data to predict the future.
Let’s imagine that Trey’s split testing software went haywire, and only one-tenth of the visitors saw the control, 137 instead of 1372. Let’s assume the conversion rate stayed the same, delivering 11 leads. This small sample size would result in a “deviant” bell curve that had a much higher standard deviation.
Here’s what the bell curves look like in this imaginary scenario.
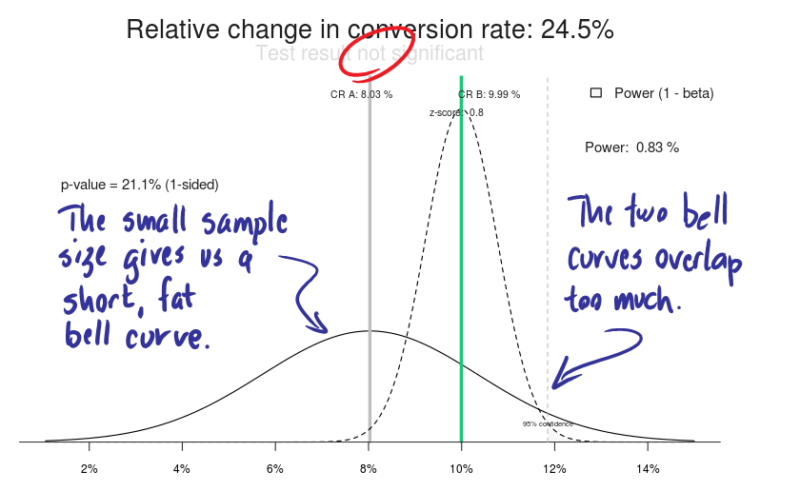
Figure 7: If the sample size was smaller for Trey’s control, our confidence goes out the window.
The two conversion rates haven’t changed, but the effect size is only 0.8, not nearly as good as 2.6.

Figure 8: The fancy numbers if only 150 people saw Trey’s winning treatment.
An effect size of 2.6 is not huge.
Even though the statistics indicated that he’d found a new winner, he needs a larger sample size, with the number of conversions approaching 200 or 300 per treatment. This test is telling him he needs to set his confidence level higher than 95%. Statistically, 97% is a much higher confidence level than 95%, even though it doesn’t look that way to us.
When You Need To Dazzle Them With Statistics
If the boss insists that your conclusions don’t make intuitive sense, it is time to disarm him with some statistics. The A/B Split Test Calculator gives us some numbers to work with.
Let’s make friends with them.
Z-score takes more into account than the effect size does. Compare the Z-score in Figure 6 to that in Figure 8. For Trey’s winning treatment, the Z-score is 1.78. The small sample size imagined in Figure 7, however, has a Z-score of just 0.80.
The bigger the Z-score, the more confidence we have in the results.
Statisticians seem to like to look at the same number presented in many confusing ways. The p-value seen in Figure 5 is calculated from the Z-score. It is the probability that our test results will NOT predict the future. I call it the phail-value because it’s the chance that I’ll fail, or “phail.”
Trey’s wonderful treatment has a Z-score of 1.781335, which can be magically recalculated to a p-value of 0.037. This means that there is only a 3.7% chance his new treatment will fail if tried again. Not bad odds.
In our small-sample-size scenario, the Z-score of 0.8025 can be recalculated into a p-value of 0.228. That means there’s a 22.8% chance that the treatment will fail if tried again. That’s too high to rely on.
Once you’ve talked about standard errors, standard deviations, effect sizes, z-scores and p-values, your boss’s eyes should have glazed over. Take that as acceptance of your decision. I’ll leave you to research the power, alpha and beta values for your own enjoyment.
Decisions Change With A Little Statistical Significance
- The disastrous email that Prim sent this month turns out to be in line with expectations when we look at it statistically, and there is no evidence that future emails will perform poorly.
- Duke needs to wait a couple of more weeks before he starts spending his expected gains from the new landing page.
- Trey can stand confident in front of his boss knowing that he made the right decision to launch his treatment, but now knows that he needs to let his tests run longer.
How many marketing programs are abandoned when they might have produced great results? How many new controls are put in place before they have proven their statistical worth?
Online marketers and business owners can’t be making mistakes like these in the coming months. Digital data is too easy to gather and the space is too competitive.
Tell us about how you are using statistics to make decisions in the comments.
(Stock image via Shutterstock.com. Used under license.)
Contributing authors are invited to create content for MarTech and are chosen for their expertise and contribution to the martech community. Our contributors work under the oversight of the editorial staff and contributions are checked for quality and relevance to our readers. MarTech is owned by Semrush. Contributor was not asked to make any direct or indirect mentions of Semrush. The opinions they express are their own.
Brian Massey is the Conversion Scientist at Conversion Sciences and author of Your Customer Creation Equation: Unexpected Website Forumulas of The Conversion Scientist. Conversion Sciences specializes in A/B Testing of websites. Follow Brian on Twitter @bmassey
View Author ProfileAdd us as a preferred source on Google
Google's "preferred sources" feature allows users to customize their search results by selecting news outlets they want to see more often in the "Top Stories" section.
Add Martech NowRelated Articles

Chasing better ROAS often reduces reach and future pipeline. Here’s how to optimize for growth instead of just efficiency.
Read More
Most brands optimize conversion while neglecting demand. Here’s what happens when the pipeline runs dry and how to fix it.
Read More
Marketing drives value, but proving it is the challenge. Here’s how CMOs can align with finance, improve attribution and earn lasting credibility.
Read More
Emotion data reveals how audiences actually respond to creative, helping brands fix weak messaging before spending millions on media.
Read MoreRelated Articles
Chasing better ROAS often reduces reach and future pipeline. Here’s how to optimize for growth instead of just efficiency.
Read More
Most brands optimize conversion while neglecting demand. Here’s what happens when the pipeline runs dry and how to fix it.
Read More
Marketing drives value, but proving it is the challenge. Here’s how CMOs can align with finance, improve attribution and earn lasting credibility.
Read More
Emotion data reveals how audiences actually respond to creative, helping brands fix weak messaging before spending millions on media.
Read More