How to track traffic quality and boost conversions
Traffic quality is a key aspect of driving conversions.
Spy on Any Website
Imagine you got a spike of traffic from Facebook amounting to hundreds of thousands of visitors — but only a trickle of them converted.
And let’s assume all the moving parts in your funnel are working properly; you’ve got a fast- loading website, great conversion copy, and well-functioning sign-up or contact forms.
Yet, with all of these things, your conversion rates from that spike of traffic were nothing to write home about. And what exactly could cause that?
Your traffic source, that’s what.
How to select the right traffic sources for your business
There are traffic sources that send thousands of visitors along with impressive conversion rates. But there are also others that can send you loads of visitors and yet drive few to no conversions.
The former drives more conversions your way because they bring in well-informed visitors — or at least visitors whom your copy is designed to convert.
So traffic quality is paramount when it comes to driving conversions. And that’s where a conversion rate optimization (CRO) tool that helps you analyze traffic can help by revealing the best- to worst-performing leads.
And here’s how they do it.
1. Automatic funnel set-up
An analysis tool like Finteza helps you discover your funnels and attribute traffic and conversions to them accordingly. In this way, you’re able to identify everything that goes into every conversion on your site.
Many (if not most) analytics tools will only show you where a conversion happens and the source they came from — unless you manually and painstakingly set them up to be more detailed about what’s going on with your funnels. But what about the other pages that aided a conversion? For example, before a visitor signed up for your whitepaper, they quickly visited your homepage. And they did that to get a general idea about your site before going back to converting on your whitepaper landing page.
Traditional tools, on the other hand, will only show that they came from your Facebook ad, for example, and converted.
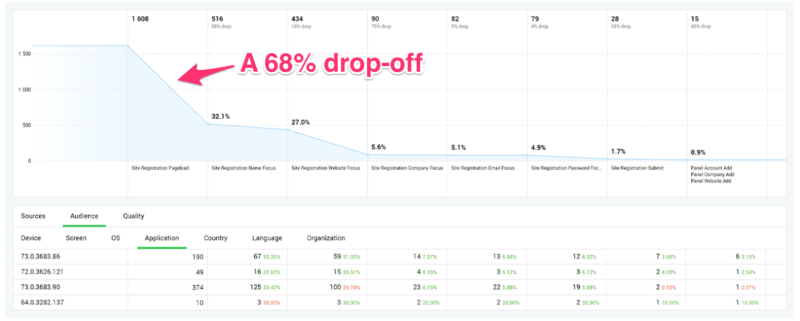
This step-by-step conversion/drop-off data is gold; it shows you exactly where potential users are dropping off on your site and why that’s happening. Not only that, you see the exact percentage of users who drop off and where they did that.
In the image above, for instance, 1,611 visitors landed on a particular page but fewer than 1 percent of them made it to sign up.
It tells you that in your 8-step funnel (in the example above), only 32 percent of your traffic move to the next stage in the funnel in a specific time period, 26 percent of them move to the next step, 5.6 percent of them move to the third step and so on. Eventually, only 0.9 percent of them converted.
This type of funnel tracking reveals the quality of your traffic sources. Once you understand that a whopping 68 percent of your traffic couldn’t make it to the second stage of your funnel (still using the example above), you immediately realize that your traffic source is a problem (assuming your landing page and other aspects of your funnel are working perfectly fine.).
Recommended Articles


2. Identify your best and worst performing campaigns
In-depth, step-by-step details about your funnels helps you identify campaigns that are worth spending your marketing budget on. You also get a better picture of who your customers are and can create customer profiles that better represent them.
And you don’t just see a step-by-step breakdown of your visitors’ journeys to drop-offs and conversions, you also see where exactly they come from.
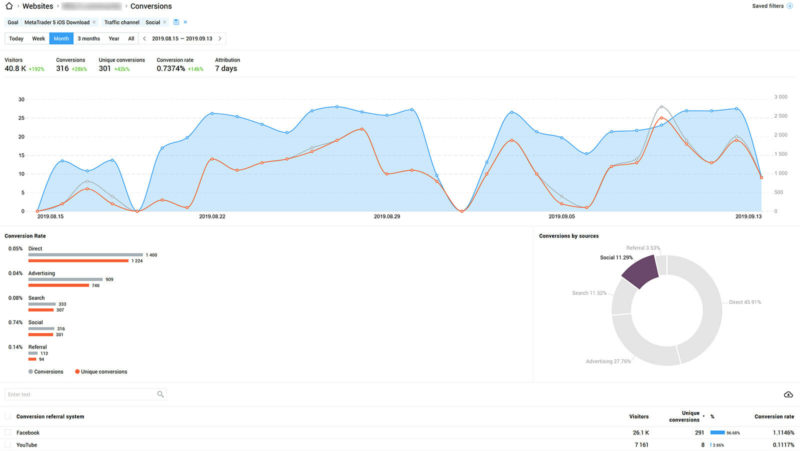
With a visually-rich referral traffic report, you’re able to assign relevant meaning to why drop-offs or conversions are happening throughout specific stages of your funnels.
If, for instance, 152 of 15,900 (0.9 percent) people converted in an email campaign you ran last month, you can tell you used a bad channel for the campaign (again, assuming you’ve got everything else right — great offers, page speed, and so on).
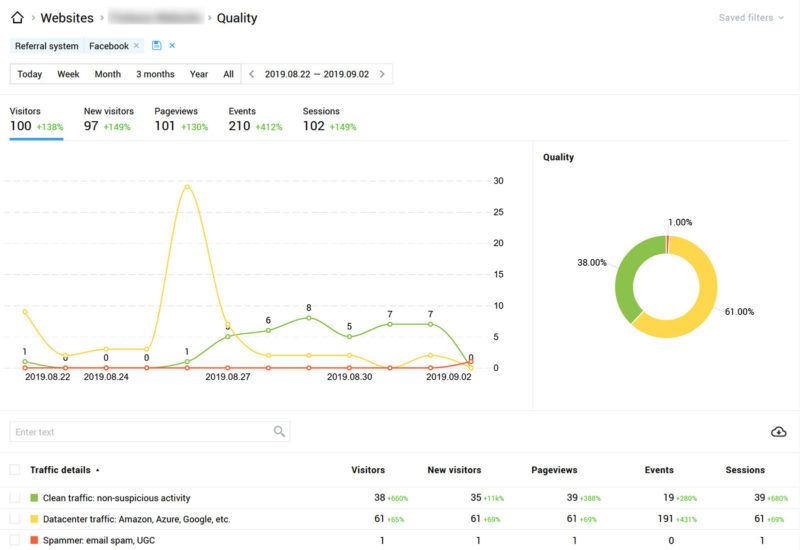
3. Traffic quality analytics
Imagine being able to get the actual percentage of bad traffic from channels you spend thousands of dollars to promote on.
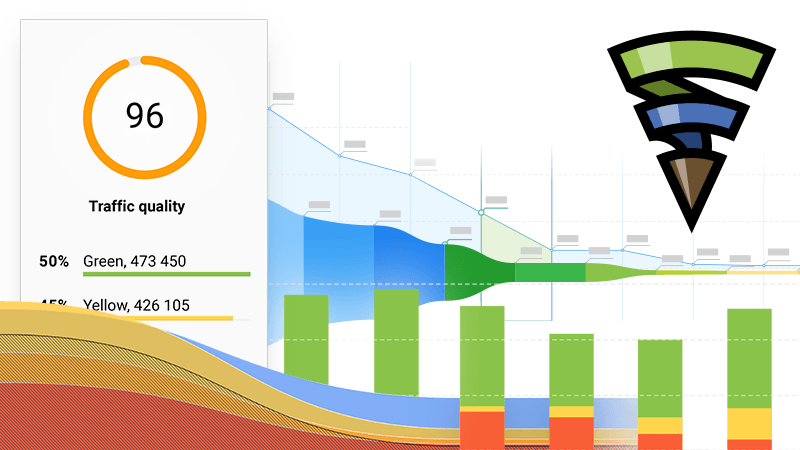
A good tool can help you out here. One that displays a clear graphics bar that depicts your traffic quality in three types (colors), can be even more useful.
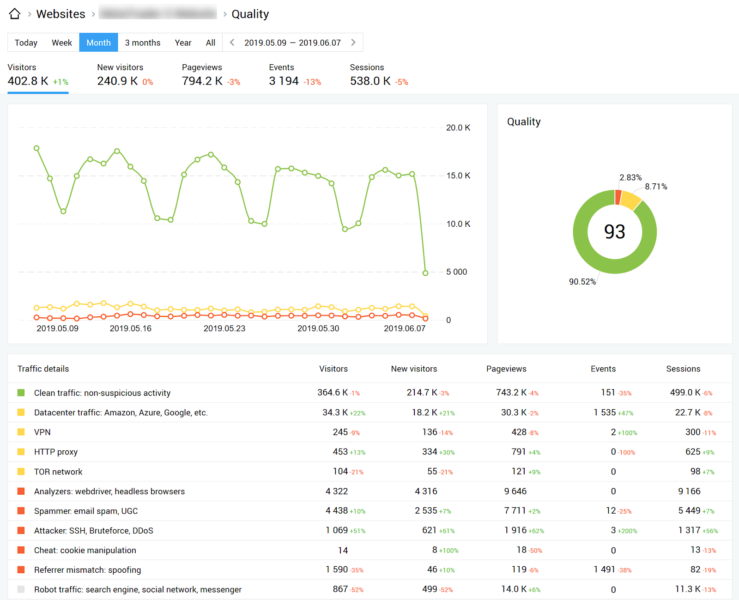
Additionally, a tool that shows the rate of quality vs inferior traffic from Facebook Ads for a certain site can also be helpful so you get the real gist of how much quality traffic is coming from every channel you’re spending your advertising and marketing budget on.
Conclusion
CRO tools have an average ROI of 223 percent.
CRO tools like Finteza, Kissmetrics and Piwik will help save you from guessing and manually trying to analyze why visitors are or aren’t converting on your site. You can get to see a step-by-step report on your traffic’s journey to conversion or drop-off. That’s an effective way to accurately improve your funnels and entire marketing campaign.
Opinions expressed in this article are those of the sponsor. MarTech neither confirms nor disputes any of the conclusions presented above.

MetaQuotes Ltd. employs a team of top developers and specialists with diverse professional backgrounds from all over the world. The expertise and passion of our employees helps global companies move closer to their business goals. We proudly create cutting edge solutions by combining industry expertise with our company's unique technologies. Our major development is the Finteza system, a revolutionary service in web analytics and online advertising. Advanced big data processing algorithms, multi-step traffic quality evaluation, superior visual reporting tools and other functions make this system stand out from similar solutions.
View Author ProfileAdd us as a preferred source on Google
Google's "preferred sources" feature allows users to customize their search results by selecting news outlets they want to see more often in the "Top Stories" section.
Add Martech NowRelated Articles
Campaign-based execution created disconnected teams, tools, and data. AI is enabling a more unified operating model.
Read More
From sales alignment to customer retention, a clear brand strategy helps companies grow faster and compete more effectively.
Read More
Automation can increase output, but creative effectiveness depends on operational discipline and strategic clarity.
Read More
Return on ad spend can’t explain growth. Here’s how to evaluate marketing’s true contribution to business outcomes.
Read MoreRelated Articles
Campaign-based execution created disconnected teams, tools, and data. AI is enabling a more unified operating model.
Read More
From sales alignment to customer retention, a clear brand strategy helps companies grow faster and compete more effectively.
Read More
Automation can increase output, but creative effectiveness depends on operational discipline and strategic clarity.
Read More
Return on ad spend can’t explain growth. Here’s how to evaluate marketing’s true contribution to business outcomes.
Read More