10 ways to “science the s**t” out of marketing
You've got tons of data, but what value are you really getting from it? Columnist David Booth explains the multitude of ways data science can help your business beat the competition.

One thing is for sure: there’s no shortage of data in today’s world of marketing. And where there’s data, there’s often analysis. But if we’re really honest with ourselves, we can probably point to many cases where analysis is done without much of a goal in mind, simply for the sake of doing something with all that data.
This is where a structured approach to data science within an organization can help. And, to paraphrase astronaut Mark Watney from “The Martian,” it’s time to use science to find better outcomes.
Data science can help make sense of all of the data, asking specific questions of it and deriving actionable answers. It can be tailored to what’s most important to your business, predicting behaviors and attributes, providing a backbone for personalized messaging, exposing the best audiences to interact with at specific points along a customer journey and more.
With some clear, defined goals for data science, the combination of statistics, computer science, mathematics and machine learning can provide real, tangible value. Here are 10 things data science can do for you that can keep you a few steps ahead of the competition.
1. Forecasting
Wouldn’t it be great to look into the future and know what’s coming? Plan for a rise or fall in the average cost-per-click you’re paying for? Know when you’ll get a surge (or drop) in demand?
Forecasting is nothing new, but the machine learning techniques enabled by never-before-seen amounts of both data and processing power have allowed us to tap into internal and external data trends, projecting just about any input and result over just about any time series. Think daily sales, yearly revenue, monthly website actions and more.
Armed with this glimpse into the future, you’ll be able to take meaningful actions and even find ways to beat the forecasts, driving your business to new heights.
2. Predictive dashboarding
The replacement of yesterday’s static reports with today’s interactive, always-on dashboards has brought with it unprecedented access to multi-sourced, mashed-up, usable information. And the technologies and platforms that are available today allow just about any organization to make the switch.
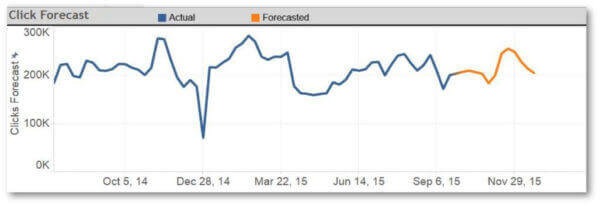
But one thing you’ll find is that most dashboards are limited to showing you things that have happened in the past. Whether you’re already using dashboards or thinking about adding them to your marketing team’s arsenal, the usefulness of these data visualizations can be vastly extended through the forecasting we just talked about.
Imagine the visualizations of your dashboards reaching off into the future, predicting what’s about to happen. Integrations between data visualization and statistical technologies and platforms can make this a reality, like the simple R / Tableau example below:
3. Lifetime value analysis
Customers are great, but we all know that for a business, some customers are better than others. In a typical value-tier segmentation where you break down all of your customers and the revenue they generated into groups, you’ll probably find that the majority of your revenue is coming from a small majority of your customers.
This kind of exercise leads to some obvious questions. Who are these customers? What behaviors and attributes do they share in common? And how can I find more of them?
Data models can help to quantify the actual value of just about any attribute or behavior you have data for, and by understanding what predicts value, you’ll be able to act on this data. You’ll know who to focus on in your current customer set, you’ll understand what marketing channels and campaigns are most likely to result in valuable new customers, and you’ll even be able to build and activate target audiences of extremely likely-to-convert, high-value prospects.
4. Churn analysis
We all know it’s much easier (and much cheaper) to keep an existing customer than go out and find a new one, so once you’ve attracted a great customer, the next step is to retain them.
Unfortunately, many of those customers will leave you, or churn. By leveraging customer data and data science techniques, you can start to understand what factors predict that churn, and even assign a score to every customer you have.
This can be used to specifically target those customers at risk of churn in order to save those valuable relationships or reward your most loyal segments.
5. Diminishing returns analysis
If you had infinite marketing budgets, could you obtain infinite sales? While the thought of an infinite budget is certainly appealing, the truth is that at some point, it doesn’t matter how much you advertise, you just won’t find any more audiences, and you won’t sell another unit.
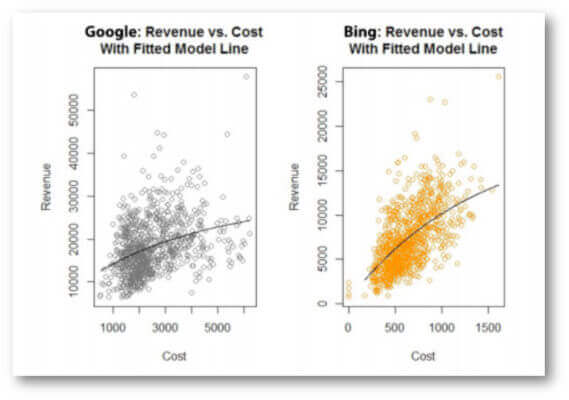
We all know this, but quantifying it can be difficult. Enter diminishing returns analysis. By looking at and modeling data, we can start to understand where your investment in a particular campaign, channel, region, brand or product begins to taper off on returns. This can help establish and distribute budgets, make sense of ad spend variability and ultimately, make sure you’re getting the most bang for your marketing buck.
6. Uplift modeling
In a multi-channel, multi-device, multi-touch-point world, it can be extremely difficult to isolate the impact of any one marketing activity. Uplift modeling can help you do just that.
Machine learning techniques can be used to estimate the increase in signals like conversion rates, sales, revenue, signups or anything else you can measure at the user level. From here, the results can be profiled to understand what attributes or behaviors are useful in predicting a response to the campaign being analyzed.
Uplift modeling can help you not only quantify the impact of a specific initiative, but also understand the best audiences for those activities in the future.
7. Topic modeling analysis
Conversations are happening about you and your brand all the time, and the reality is that very few of those conversations are happening on media you can control. Social media has exploded, and the vast amount of textual data available and being generated every second of every day can be very difficult to make sense of.
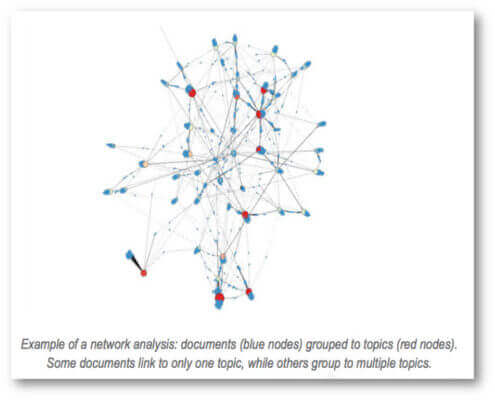
Topic modeling groups phrases, sentences and just about any other form or source of text into common topics, and then combines this with network visualization to make sense of this unstructured data.
For example, my firm, Cardinal Path, performed a topic modeling analysis of a popular web forum, creating a network visualization that could be explored as a graphic representation of the relationships between posts. This modeling was able to uncover relationships between specific posts, suggesting related chains of topics that could be leveraged for ongoing social media optimization for specific audiences.
8. Purchase intent analysis
Simply put, purchase intent analysis can predict the likelihood of a purchase based on just about any digital signal we can measure, and then assigns a very specific value to that digital signal.
For example, if a visitor comes to a website, we can use this modeling to figure out that a “click-to-call” is worth exactly $1.45 of predicted revenue, while an image carousel interaction is worth $0.02. We can break this down even further across product lines, brands, geographies and just about any other segment we can think of.
If you’re a marketer, understanding the predicted values of these actions effectively sets the goalposts for your campaigns. You’ll know where to focus your efforts, and you’ll know exactly what your cost-per-action targets should be in order to ensure you’re getting the best ROI from your advertising spend.
9. Attribution modeling
Attribution modeling has quickly become a required part of the enterprise marketing stable, and rightly so. With so much happening in the digital space, the ability to leverage web analytics, ad servers or log files to map very specific user interactions allows us to build very specific models of touch points across campaigns, channels and marketing assets.
There are a number of solutions in the marketplace today, but at the end of the day, digital, multi-touch attribution modeling will help you understand which of your advertising channels, campaigns, and even placements are contributing to online conversions and value.
These tools can ingest massive amounts of data and make sense of it all both quickly and frequently, allowing you to best optimize budgets across search, display, email and more.
10. Media mix modeling
Before digital attribution, there was an econometric approach to understanding the contribution of different channels and optimizing media budgets. Media Mix Modeling (MMM) has been around for a long time, and it models the future by taking a holistic look across historical advertising activities, spends and revenues.
This isn’t based on tags and cookies that are tracking individual user interactions. Instead, it’s bringing all of these macro signals into a process of model development that leads to an understanding of advertising response curves, saturation points, the “decay” of advertising campaigns and halo effects between brands and advertising efforts.
It’s worth noting that a traditional media mix model’s value can be extended further with deeper breakdowns of the many digital data sets available. For example, a series of owned and earned media activities across channels like YouTube, Facebook, Twitter, Instagram and more can be broken down to understand just how valuable a retweet is or to quantify exactly how it might impact another channel like search.
It’s time to science the s**t out of marketing
So there you go. As Mark Watney looks down on Earth from Mars, let’s make him proud of the world of marketing. Get out there and let the data science unlock the value in your data!
Opinions expressed in this article are those of the guest author and not necessarily MarTech. Staff authors are listed here.
Related stories
About the author