‘Tis The Seasonality Of Your Metrics
A few posts back, I examined a simple technique for using an exponential moving average (EMA) on your time-series metrics. This has the advantage of smoothing out the metrics while at the same time keeping a “memory” of all previous values of the metric that came before. It also has the side benefit of being […]
A few posts back, I examined a simple technique for using an exponential moving average (EMA) on your time-series metrics. This has the advantage of smoothing out the metrics while at the same time keeping a “memory” of all previous values of the metric that came before. It also has the side benefit of being easier to update as new values to your metrics become available.
This time, I want to show you a technique to fix another common time-series problem: seasonality. Yeah, your metrics are down in January, but is that the usual post-holiday sales slump? Or is it the start of a true downtrend that you need to keep an eye on? The article will illustrate a fast and simple way to de-seasonalize your data.
Let’s work through an example step by step:

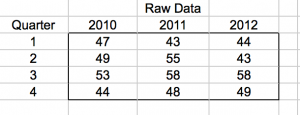
Imagine we’re working at a software company where the enterprise-level product has a fairly long sales cycle, and our metric is actual raw conversions during a quarter. If you were looking at your conversion sales metrics in the above chart, how are you doing lately? Better than 2010? As good as 2011? Here’s the raw data:
Step 1: Collect Metrics Data Going Back At Least 3 Full-Cycle Periods
For most folks, this means quarterly or monthly data going back three years. Yes, you can use weekly or daily data, although you’ll usually want to smooth this data out (cha-ching! another great use for the exponential moving average!).
And, it needn’t be over the course of an entire year if the “seasons” your data go through isn’t measured by the calendar months — so if you’re looking at day-of-the-week data, say, to compare how your customers act on Monday versus Thursday, then a good 8-12 weeks of data would be a smart minimum.
Step 2: Compare Like Time-Periods To Like Time-Periods
For example, look at all the Januarys, or all the Tuesdays, and calculate an average.

Here, I use a simple average rather than the EMA. Because the EMA is designed to be useful for the time-series period compared sequentially — comparing a February to the January that came before it — and we’re not doing that here; rather, we’re treating the data as pure data, and our end goal is to extract the seasonal time-series.
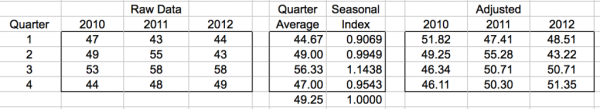
Step 3: Normalization
Compare all these averages to each other, and divide each of the averages to the average of averages, yielding a seasonal adjusted factor for that time period, on average, compared to the normal value, referred to as “normalization.”
This is how we compare “apples to apples” across multiple years and in the context of the entire seasonal effect.
Step 4: Divide Each Original Data Point By Its Seasonally Adjusted Factor
This gives you an effective value for that metric with the seasonal component removed.
Step 5: Draw Conclusions
Look at this new de-seasonalized data and extract conclusions, if any, from it.
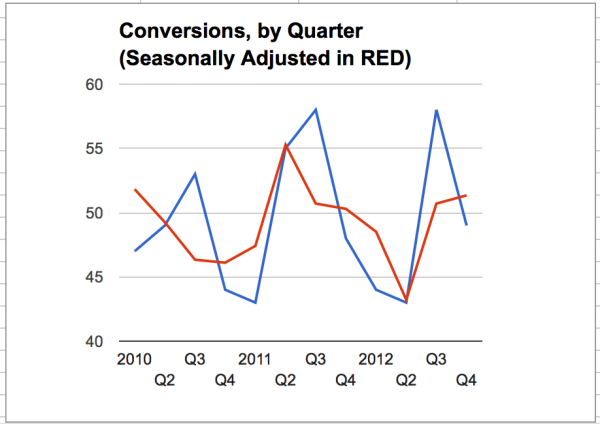
Now that we’ve subtracted out the seasonality of the sales, are your conclusions any different? Looking at the red, de-seasoned data, it sure looks like the 2012 low is even lower than the end of 2010, and the 2012 isn’t nearly as high as in 2011. This should cause some consternation in the next sales meeting!
Of course, there are a zillion caveats here. Is your data even seasonal in the first place? Looking at the blue line, the best we can say is “maybe” — it’d be great to have more data. Perhaps a monthly breakdown of data instead of quarterly.
Another caveat might be cyclic — if the economic cycle dominates your sales cycle, then it can easily swamp the seasonal component — but if that’s the case, why the lower low in 2012 sales?
So, my question this month: when you look at your metrics, do you account for seasonality? Or do you just look to see if the numbers are “up” in the most recent report? You might be missing a key insight.
Opinions expressed in this article are those of the guest author and not necessarily MarTech. Staff authors are listed here.
Related stories
About the author