How To Do Attribution Modeling & Budget Allocation
In my last post, I covered customer lifetime value calculations and how to leverage CLV to identity high- and low-value audience segments. One of the most effective use cases for CLV is around budget allocation. Combining channel attribution modeling and CLV calculations, we can make highly calculated decisions around which channels are over- versus under-performing. […]
In my last post, I covered customer lifetime value calculations and how to leverage CLV to identity high- and low-value audience segments. One of the most effective use cases for CLV is around budget allocation.

Combining channel attribution modeling and CLV calculations, we can make highly calculated decisions around which channels are over- versus under-performing.
Audience modeling is about understanding what distinguishes a high-value user from a normal or low-value user on site. The next logical step is to go back and determine which channels are driving those high value visitors. Putting it all together, we can build a more sophisticated attribution model to determine allocation of budget, direct response CPA goals and/or ROAS thresholds.
In the past few years, a number of shops have popped up offering advanced attribution modeling, segmentation, and pathway visualization. Each platform has its own unique twist however Google Analytics offers a solid attribution modeling system free of charge so it’s a great place to start.
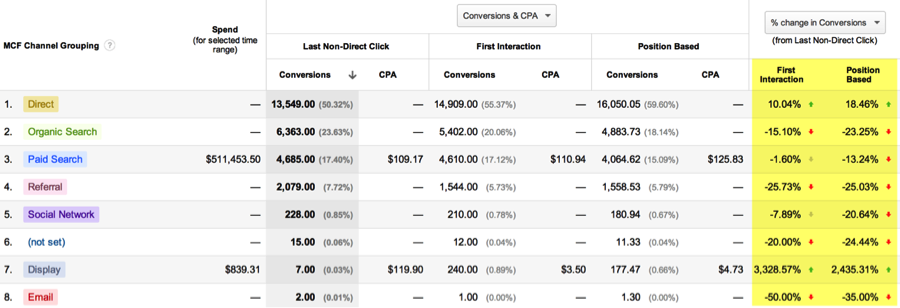
Understanding the distribution of user value by referring channel begins with an aggregate analysis. The industry embraced attribution model is last in or last non-direct (meaning the last non-direct site visit gets credited with the conversion). The easiest way to come to grips with where each channels sits, in aggregate, within the acquisition funnel is to compare the last non-direct with some other models to see how the percent allocation of conversions changes.

(Click to enlarge.)
In the analysis above, I have included three basic models:
- Last Non-Direct Interaction
- First Interaction
- Position Based model
In Google Analytics, a position model defaults to 40/20/40 – 40% credit for the first touch, 40% credit for the last touch, and 20% distributed to all middle touch points.
While insightful, none of these models are complete. That said, they provide directional insight as to which channels are upper funnel versus lower funnel.
(Click to enlarge.)
Look at the highlighted fields on the right — comparing the alternative attribution models to Last Non-Direct we can clearly see that Display drives more upper funnel interactions whereas Organic seems to be the primary beneficiary of latent actions.
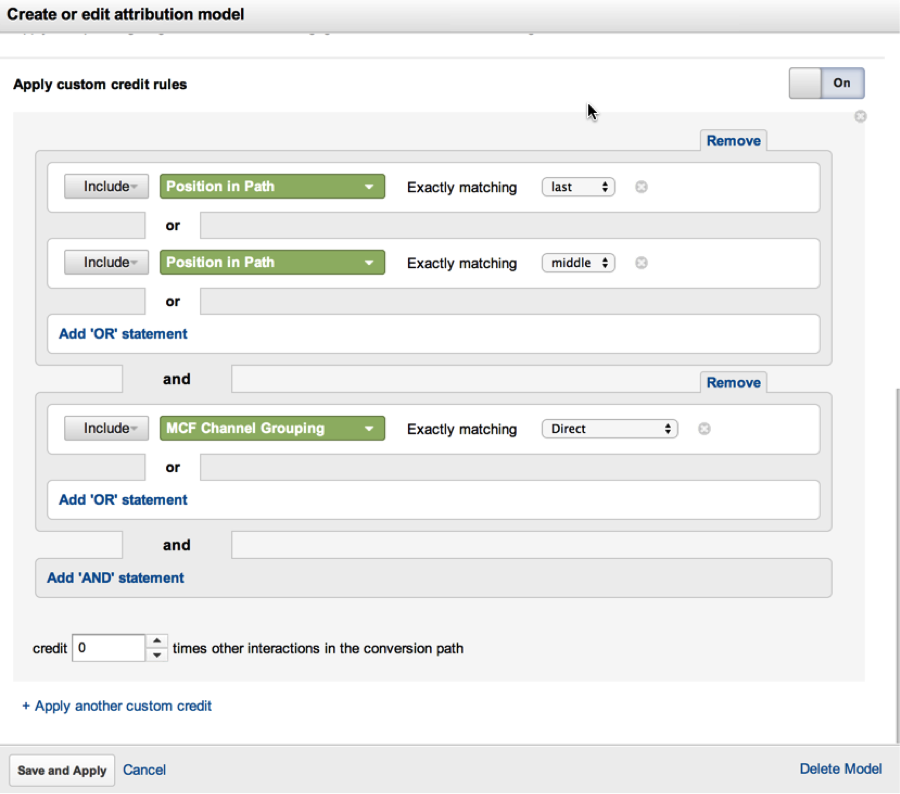
To complete the model, we need to take into account some additional insights. Fortunately, GA offers custom attribution modeling rules to get a little more intelligent about how to give credit.
I believe that awareness has to come from somewhere — people don’t just miraculously know my brand name and search for my website. As a result, a rule I like to implement is: click paths where Direct searches are last or in the middle somewhere should negate those Direct visits within the model.
(Click to enlarge.)
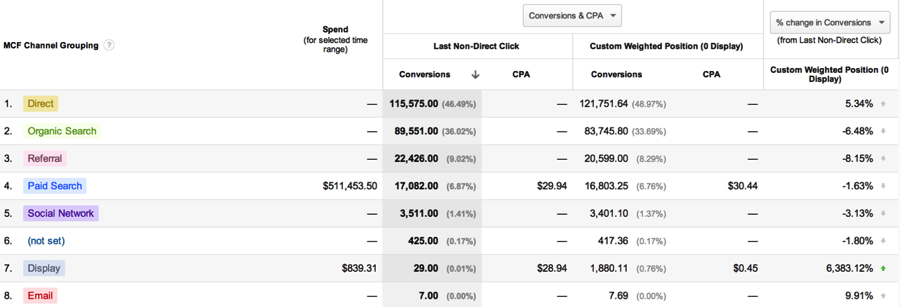
As a result we get a more honest perspective on where to dole out credit:
(Click to enlarge.)
Note that the conversion allocation percent changes aren’t that significant for all channels except Display — a channel which traditionally gets shafted in a last-click attribution model.
Our custom model highlights the true value of Display and dramatically shifts the perception of performance. Let’s assume our goal CPA is $8. Looking at the table above, using the traditional Last Non-Direct model we would immediately shut off Display as performance is not acceptable. That said, leveraging our custom weighted model, Display boasts a CPA of $0.45! It would appear we’ve found a source for some incremental revenue opportunity.
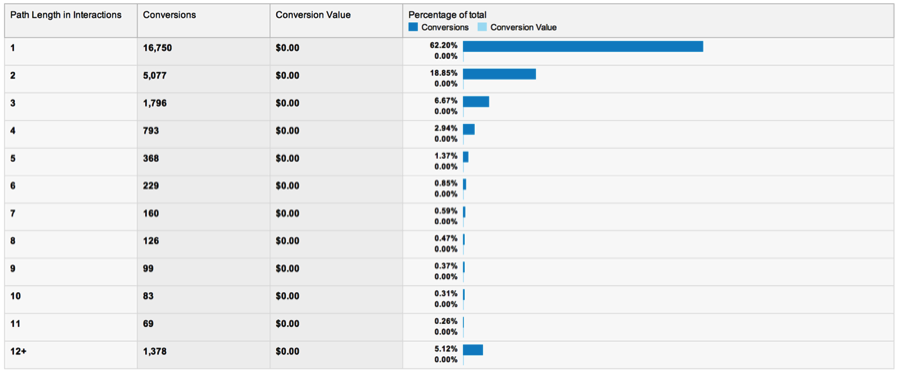
The purpose of this exercise is to challenge you to challenge your analytics. In the multi-channel ecosystem, it’s an expectation that users have several touch points prior to making a purchase:
(Click to enlarge.)
The question is: Are you throwing away potential revenue because you’re misallocating conversions? Probably. Time to take a closer look at your model and reconsider your budgets.
Stock image used with permission of Shutterstock.com
Opinions expressed in this article are those of the guest author and not necessarily MarTech. Staff authors are listed here.
Related stories
About the author