Who’s Winning The Browser Wars? It Depends On Whom You Ask
A couple of recent articles have looked at the current state of browser usage, but they don’t agree on which browser is No. 1 right now. On Wednesday, Shareaholic — the social media button provider — shared a chart showing browser usage in April across more than 200,000 publisher sites that use its buttons. According […]
A couple of recent articles have looked at the current state of browser usage, but they don’t agree on which browser is No. 1 right now.
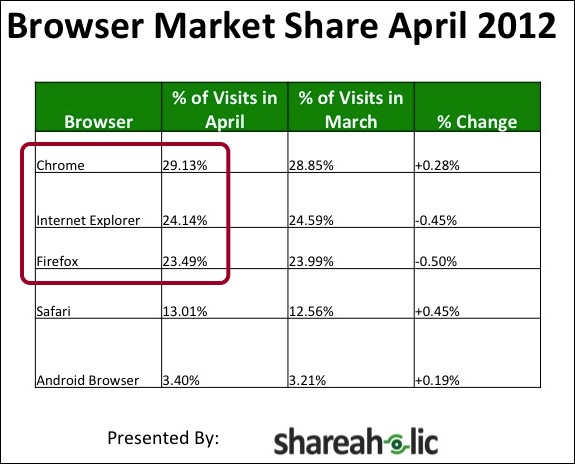
On Wednesday, Shareaholic — the social media button provider — shared a chart showing browser usage in April across more than 200,000 publisher sites that use its buttons. According to their data, Chrome has a five percent lead over Internet Explorer, with Firefox a very close third.
Shareaholic puts Safari at about 13 percent overall market share — a number that includes iOS traffic. Android browser usage is also on the rise as you can see above.
StatCounter’s Browser Share Statistics
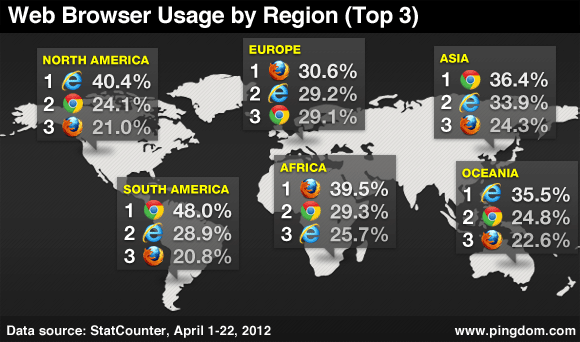
But the numbers were different in a Royal Pingdom report about ten days ago. That report used data from StatCounter during the first three weeks of April, and was based on visits to more than three million websites — a larger data set than the Shareaholic numbers.
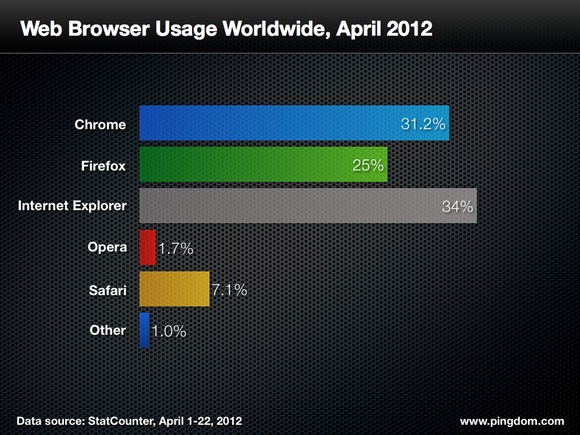
I’ll show two of several charts from that article — the first showing the top three browsers across different international geographic areas, and the second showing the aggregate worldwide browser usage.
As you can see, StatCounter’s data differs from Shareaholic in that Internet Explorer remains the most popular browser overall, but Chrome is a close second place and gaining rapidly.
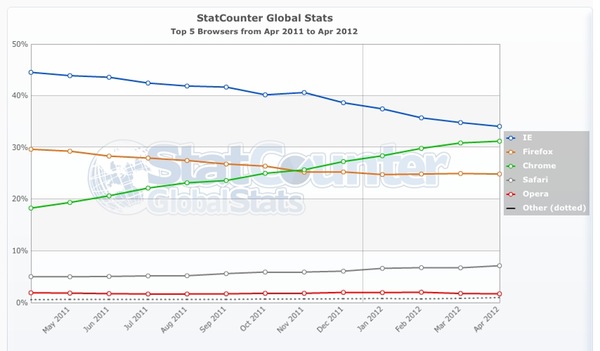
Using StatCounter’s website, we can see browser share trends for the past 12 months — trends that show how Chrome’s steady incline has almost mirrored IE’s steady decline.
What Do Others Say?
There are other sites and measurement services that offer browser usage data, too. Net Market Share, for example, shows Internet Explorer in a much more dominant position in April, with 54 percent browser share among desktop web activity.
Ultimately, while it’s important for marketers to know the global trends regarding browser usage, what matters most is watching the trends for your own websites. On a couple general (i.e., non-tech) sites that I watch, Chrome is a distant fourth while Internet Explorer and Safari battle for the most popular browser. On my own SEO blog, Small Business Search Marketing, Firefox and Chrome are the top two browsers.
So, for the Who’s winning the browser war? question, the answer is — like many answers in the online marketing field — it depends.
Opinions expressed in this article are those of the guest author and not necessarily MarTech. Staff authors are listed here.
Related stories


