Marketing analytics: What it is and why marketers should care
Turn data into growth. Learn how marketing analytics tracks performance, reveals insights, and drives smarter decisions across all your campaigns.
Marketing analytics shows you which campaigns actually drive revenue—not just clicks and impressions—so you can prove ROI and invest in what works.
With budgets under pressure, CMOs need evidence that every dollar contributes to business growth. Vanity metrics won’t cut it anymore; you need analytics that connect marketing activities directly to revenue, acquisition, and long-term value.
This guide explains how to build a marketing analytics framework that unifies data across channels, enables accurate attribution, and turns insights into decisions that optimize spend. You’ll learn how to move from reporting on past performance to predicting what will drive results so that you can validate marketing’s value and scale success.
What is marketing analytics?
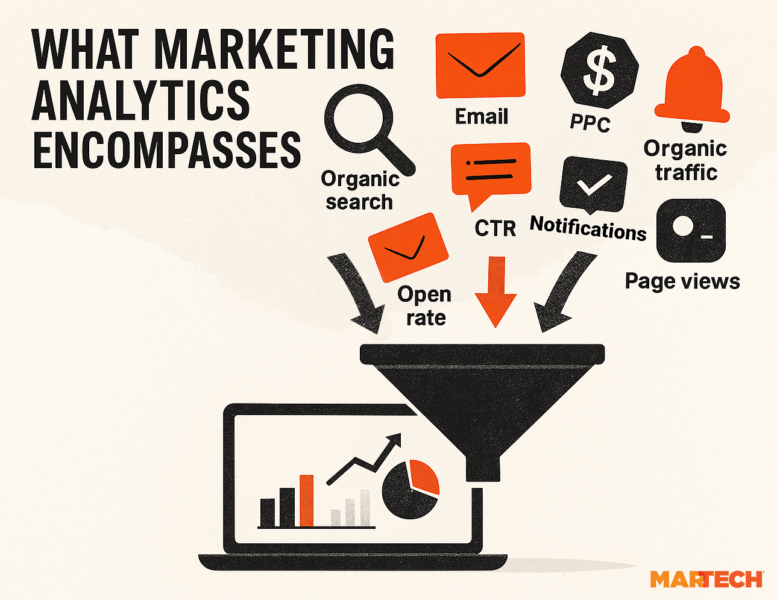
Marketing analytics is the practice of collecting, measuring, and interpreting data to inform better marketing decisions. It includes digital channels, offline interactions, CRM data, paid advertising, organic efforts, content performance, and sales enablement activities.
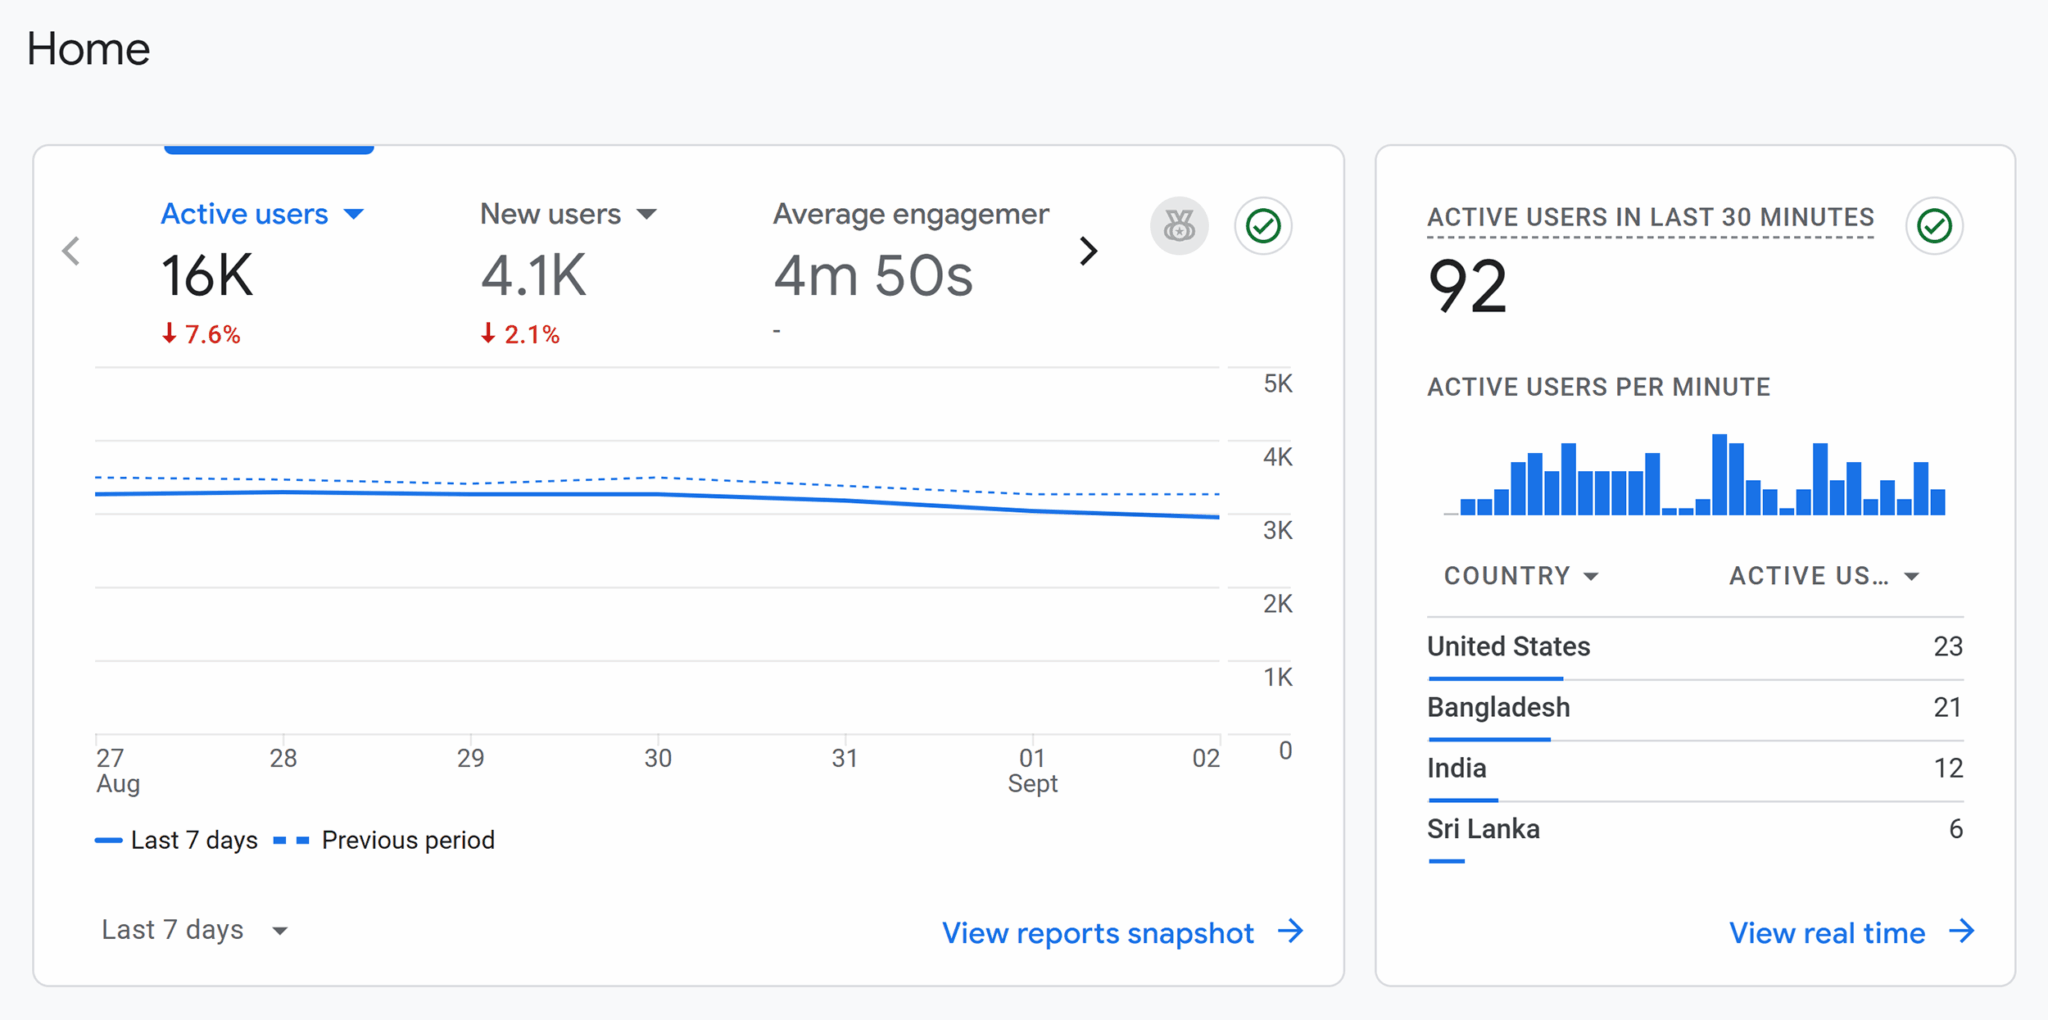
As a result, modern marketing analytics goes far beyond Google Analytics dashboards.
Google Analytics, for example, can’t help you track the number of people who got an SMS message from a location-based campaign and then made a purchase in your store later that day. Similarly, it can’t determine if your CEO’s thriving LinkedIn presence is drawing leads that get in touch through direct messages.
To capture these insights, you’d need to integrate your SMS platform with point-of-sale systems using unique promo codes or customer IDs, and manually log LinkedIn-generated leads in your CRM with proper source attribution. This requires connecting multiple data sources that Google Analytics simply can’t access on its own.
What’s measured in modern marketing analytics?
Today’s marketing analytics is about creating integrated systems that connect customer behavior across channels, provide attribution insights, and enable data-driven decision-making at every level of your organization.
Marketing analytics may include tracking:
- Website analytics: Monitor which blog posts drive the most demo requests, identify pages with high bounce rates that need optimization, and track which referral sources bring your highest-value customers.
- Social media interactions: Measure which LinkedIn posts generate the most qualified leads, track Instagram story completion rates to optimize content length, and identify which social channels drive actual sales rather than just engagement.
- Online purchases and transactions: Connect email campaign clicks to actual revenue, track which lead magnets convert prospects into paying customers, and measure the time it takes for leads to progress through your sales funnel.
- Paid ad campaign metrics: Identify which ad creatives generate the lowest cost per acquisition, determine optimal bidding strategies for different audience segments, and reallocate budget from underperforming campaigns to high-converting ones.
- Customer data: Analyze purchase patterns to predict churn risk, segment customers based on lifetime value for targeted campaigns, and identify which onboarding sequences lead to higher retention rates.
- Event data: Track which promotional tactics drive the highest event attendance, measure networking session engagement to improve future programming, and connect event participation to post-event sales conversations.
- Foot traffic: Correlate digital ad campaigns with in-store visits, optimize store hours based on customer visit patterns, and measure how local SEO improvements affect physical location traffic.
How marketing analytics differs from business and sales analytics
Marketing analytics connects marketing spend directly to business results, making it essential for proving ROI and optimizing budget allocation.
While business analytics focuses on overall company performance, sales analytics examines revenue pipelines, and marketing analytics specifically tracks how marketing efforts influence customer acquisition, engagement, and retention. It bridges the gap between marketing activities and business outcomes by:
- Connecting touchpoints across the customer journey rather than analyzing channels in isolation.
- Attributing revenue to specific marketing activities instead of just measuring engagement metrics.
- Providing predictive insights about which campaigns and channels will drive future growth.
- Enabling real-time optimization of campaigns based on performance data.
While marketing analytics is distinctly different from business and sales analytics, the three are often interconnected. Sales data can be used in conjunction with campaign performance data to determine if a viral TikTok post drove conversions, for example, to assess whether specific marketing tactics are achieving business objectives.
This level of insight transforms how marketing leaders make critical budget decisions. Instead of allocating spend based on assumptions or vanity metrics, marketing analytics provides the data needed to shift budgets toward high-performing channels, eliminate wasteful spending, and justify marketing investments to executive teams with concrete revenue attribution.
Your Competitors Are Already Tracking Their AI Search Visibility—Are You?
✓ See exactly where competitors appear in ChatGPT, Perplexity, and Gemini
✓ Compare your AI search share of voice vs. top 5 competitors
✓ Identify AI visibility gaps you can capture this quarter
Built for enterprise martech stacks
Types of marketing analytics models
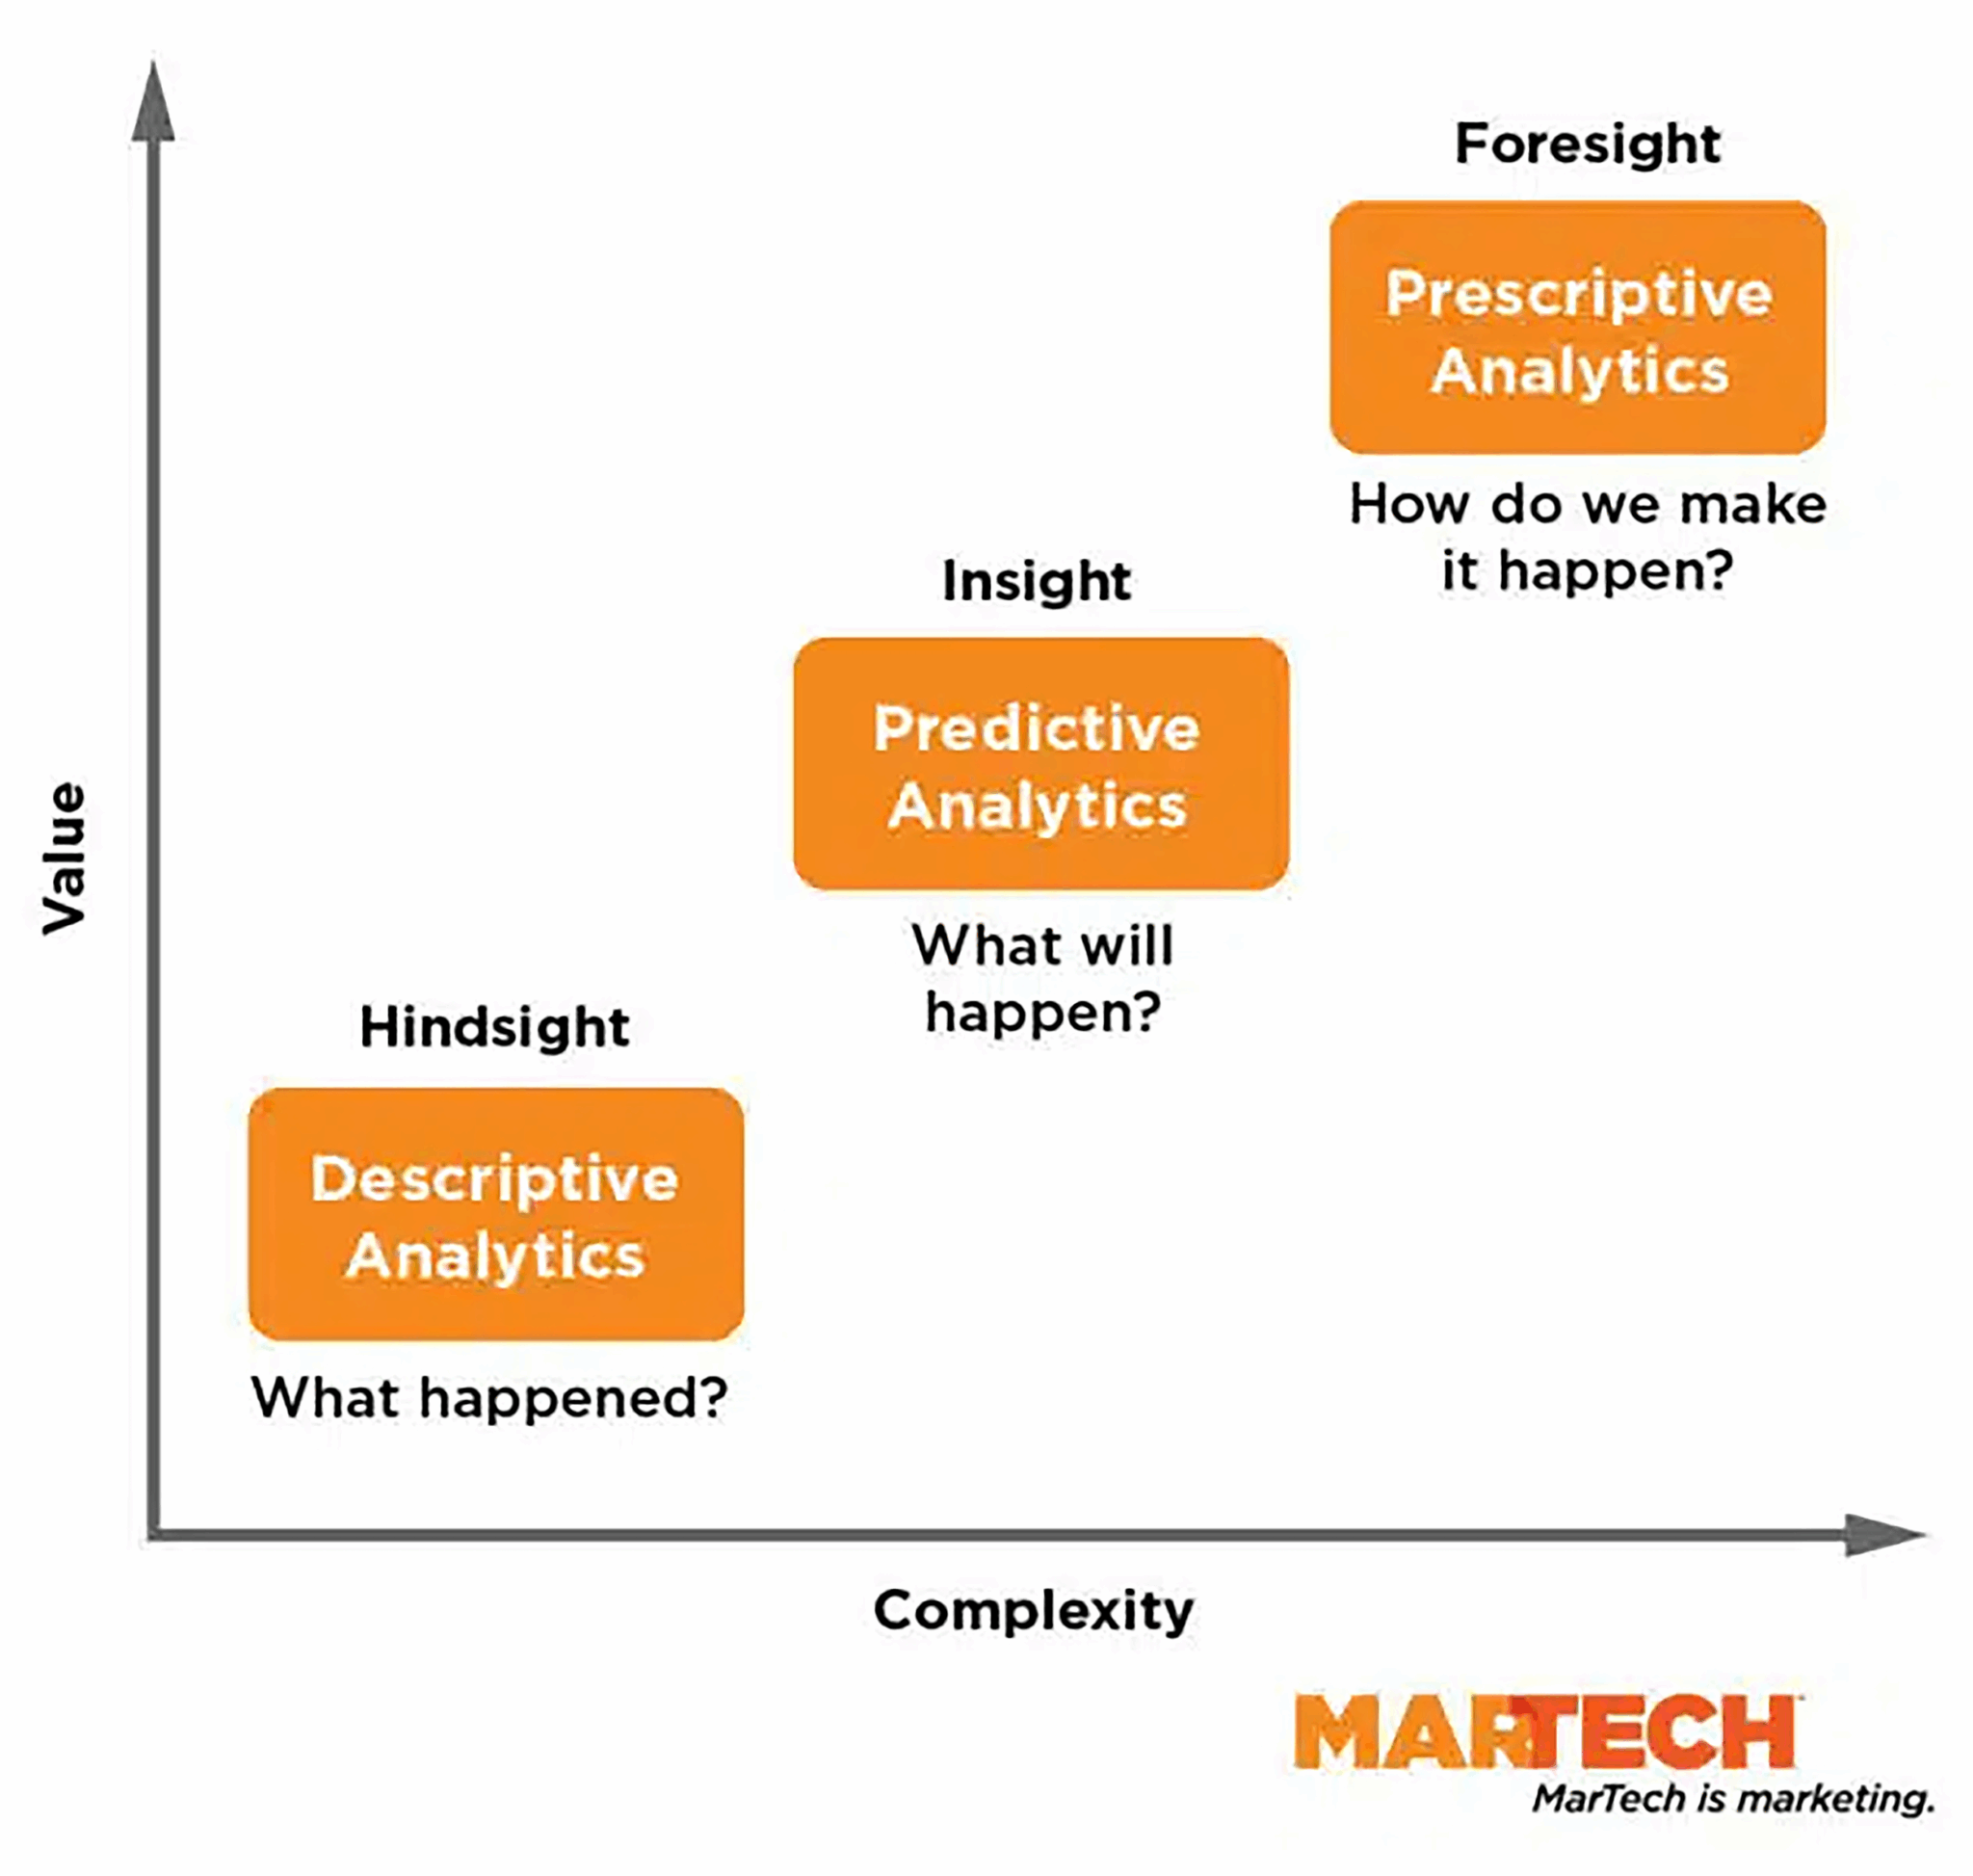
There are three marketing analytics models that marketers use when planning, managing, and optimizing marketing campaigns. The goal of all three models is to help marketers make more insightful decisions about how to plan their campaigns and allocate their budgets.
- Descriptive: Use historical data culled from prior campaign activity to understand what happened and inform future campaign planning.
- Predictive: Use insights from past campaigns and potentially current trends to predict customer behavior.
- Prescriptive: Use data from all touchpoints. They weigh the impact of each interaction and initiative and are often highly targeted.
Why marketing analytics matters more than ever
In 2025, marketing analytics can be the difference between proving ROI and losing budget.
Gartner’s 2025 Tech Marketing Benchmarks Survey found that technology marketers with high annual revenue listed “proving ROI with analytics” as a top-three challenge that impacted how they demonstrated success.
As attribution has become increasingly challenging, AI has also reshaped our understanding of digital visibility. As marketing channels and attribution evolve, however, it’s more important than ever before to have a strong analytics tech stack to adapt to these changes.
AI is reshaping marketing visibility
AI overviews in search engines and chat tools, such as ChatGPT, are changing how visibility is measured.
Marketers have long used metrics, like clicks and rankings, to assess visibility in search engines, which are easily attributable through platforms like Google Analytics, Ahrefs, or Semrush. AI tools are now changing marketing visibility and how we track and attribute campaign success.
Google’s AI overviews, for example, are tied to a recent and significant decrease in clicks for a large number of websites. However, some companies are reporting that they’re seeing decreased clicks but higher quality traffic, marking a new trend in the future of SEO.
Leigh McKenzie, head of content at Backlinko, noted that his team’s SEO strategy continues to drive significant monthly visitors and a higher ROI per visitor, despite a decrease in clicks.

Tools like ChatGPT and Claude are also capturing a significant portion of search traffic, making attribution difficult. You can tell that ChatGPT was a referring website, for example. But you won’t know exactly how often your brand is showing up in LLMs’ search results, or in what context, since they’re black box tools.
Currently, tracking direct clicks from Google and LLMs is a good starting point. You should also ask customers how they discovered your brand, as they may share that an LLM recommended it to them.
As more interactions often happen outside traditional marketing channels and AI overviews are changing traditional attribution, it can be more challenging to understand the complete customer journey and how to optimize for it.
Attribution challenges are multiplying
AI and LLMs aren’t the only factors making attribution more difficult. Factors like privacy changes and more complex customer journeys across multiple devices are also playing a role:
Multi-device complexity
Customers are now making purchasing decisions across multiple devices. They may research on their phones, but later purchase on a desktop or even in person. Traditional tracking methods struggle with tracking cross-device purchases.
Fortunately, modern analytics and integrated platforms can track customer behavior across multiple devices, providing a better understanding of the customer journey.
Cookie deprecation and privacy changes
Some platforms, like iOS or Firefox, now require that sites and apps request permission to track user activity. Regulations like GDPR also require companies to adapt their cookie usage. Marketers need new methods to understand customer behavior to adapt to privacy regulations and the limitations of third-party cookies.
While third-party cookie tracking remains in effect, you may want to incorporate more first-party data into your campaigns. There are also workarounds for some third-party advertising platforms, allowing you to take advantage of attribution and retargeting, such as Meta’s Conversions API.
Dark social and unmeasurable touchpoints
Word-of-mouth and social sharing outside trackable platforms influence purchasing decisions. However, they remain largely difficult to track with traditional analytics platforms.
While attribution will always be tricky here, you can ask customers directly how they discovered your brand. Use post-purchase surveys or have sales members ask customers how they found you to determine if word-of-mouth played a part.
Teams need to move beyond reporting to decision-making
Predictive analytics can help your team make more informed decisions, leading to improved results. You can discover not only what happened but also why it happened—and you may even be able to predict what happens next.
Let’s say you see a decrease in conversions from site traffic. You identify a high percentage of drop-offs on a key landing page. So, you implement A/B testing and use tools like heatmaps to see where users stop engaging. When you identify the problem, you can make immediate improvements to the page.
This shift from descriptive to predictive analytics is what separates high-performing marketing organizations from those struggling to prove value. You can see whether:
- There’s a messaging issue, and tweaking the copy to reflect the benefits of certain features better can increase conversions.
- There’s a pricing issue, and adjusting the pricing or the offer moves the needle.
- There’s a traffic quality issue, and you need to adjust the PPC campaigns to ensure they’re sending the right audience segments to your landing page.
Without the ability to test and assess the issue, you’d be left guessing—and potentially guessing wrong.
Who uses or works with marketing analytics tools and how?
Marketing analytics tools are typically used predominantly by marketing teams and marketing data analysts. They’re often used for purposes like budget optimization, message planning, or customer research.
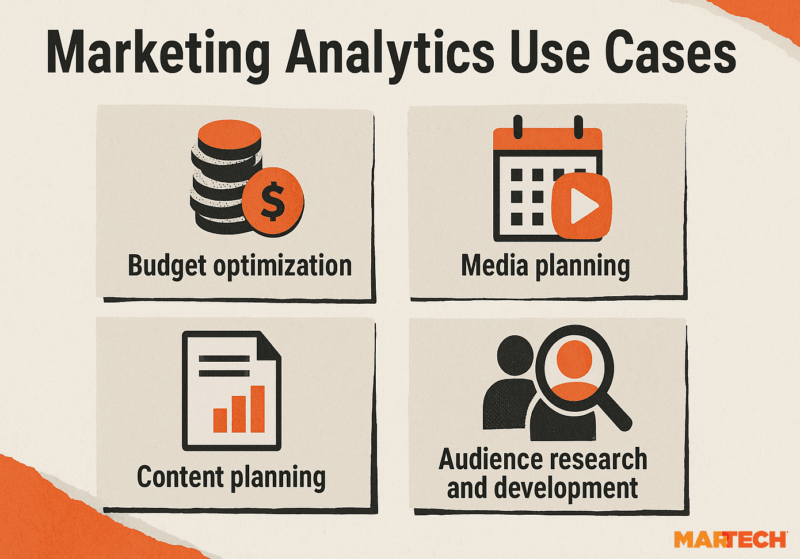
Budget optimization
Your marketing budget has been reduced by 10%, 15%, or 30%, and you need to refocus your marketing strategy on the most effective channels and tactics. By analyzing performance against predetermined KPIs, you can reallocate your budget to the historically most effective channels.
Media planning
Marketing analytics provides historical data that can be used to make better media planning decisions. You can use results from past campaigns to inform ad creative, media mix, and test new channels. Importantly, marketing analytics ensures that your media choices reflect your audience’s preferences, rather than just what your intuition is telling you.
Content planning
Website traffic metrics, paid search campaign reports, keyword trends, and user behavior provide valuable information about what your customers are interested in. You can use this information to plan your content and messaging strategies.
For example, you could review top content on your website, the most engaging social media posts, and use social media listening tools that surface insight and buzz around a given trend or product.
Audience research and development
Marketing campaign data can help you better define and understand your customers, enabling you to build more targeted audiences for future campaigns. Identifying customer content preferences can help you craft content that specific audiences are more likely to engage with.
Key goals of marketing analytics
The variety of touchpoints connected to the modern customer journey is transforming the way marketers track their campaigns. Where once data analysis focused on browser and website activity, consumers are now combining online and offline channels to learn about companies, brands, and products.
Key goals of marketing analytics typically include the following:
- Understand what marketing channels, tactics, and approaches help you achieve your business objectives.
- Measure ROI from marketing and advertising initiatives for improved budget allocation.
- Capture data from website sessions to gain a deeper understanding of what content customers value.
- Observe how users interact with website features and objects, such as buttons, videos, and forms.
- Monitor, manage, and optimize performance for digital and offline marketing campaigns.
- Create audience segments for more precise ad targeting and content personalization.
- Enable different teams and departments to share campaign performance and collaborate on marketing strategy.
- Understand how content, marketing, sales, customer behavior, and all marketing and sales initiatives are working together.
Core metrics by channel
Understanding which metrics matter for each channel helps you focus on data that drives decisions rather than vanity metrics that look impressive but don’t impact business outcomes.
Organic search (SEO)
SEO analytics should focus on how organic visibility translates to business outcomes. These metrics help you understand which content strategies drive qualified visitors who actually convert into customers.
- Organic traffic growth: Monthly and quarterly visitor trends, which can help you assess if SEO or visibility strategies are working.
- Click-through rates (CTR) by query type: How often users click on search results to your page. Ideally, look at CTR for both branded and non-branded queries separately.
- Conversion rate by landing page: Percentage of visitors who convert, which can reveal which pages drive business outcomes.
- Share of voice: How often your content shows up compared to competitors for target keywords, which can help you assess your overall visibility. Tools like Semrush’s Traffic Analytics can help you compare performance against direct competitors.
- Assisted conversions: How organic search touchpoints influence conversions in other channels, which can help you track how site content plays a role in the customer journey.

Paid media (PPC, social ads)
Paid advertising generates immediate data, but the key is measuring efficiency and incrementality rather than just volume. Focus on metrics that help optimize budget allocation across campaigns and audiences.
- Return on ad spend (ROAS): Revenue generated per dollar spent, which helps you identify the most profitable campaigns and audiences.
- Cost per acquisition (CPA) by audience segment: How much it costs to acquire customers from different segments, which helps you allocate budget to the most efficient audiences.
- Quality Score trends: Platform ratings of ad relevance and landing page quality, which can indicate whether your creative and targeting need optimization.
- Attribution path analysis: How paid ads influence the customer journey, which helps you understand whether ads drive immediate conversions or assist later purchases.
- Incremental lift: Additional conversions generated beyond what would have happened organically, which proves the actual impact of your paid campaigns.
Email marketing
Email can deliver exceptionally high ROI. However, success depends on segmentation and lifecycle targeting. These metrics help you optimize for revenue, not just opens and clicks.
- Revenue per email: Total revenue divided by emails sent, which provides ROI clarity and helps you understand which campaigns generate the most value.
- List growth rate vs. churn rate: Net subscriber health over time, which helps you maintain a growing, engaged audience base.
- Segmentation performance: Revenue per subscriber by audience segment, which helps you identify your most valuable customer groups for targeted campaigns.
- Conversion rate by email type: Performance comparison between welcome series, promotional, and nurture campaigns, which helps you optimize your email strategy mix and prioritize high-converting campaigns.
- Cross-channel attribution: How email influences other channel performance, which helps you understand email’s role in the broader customer journey.
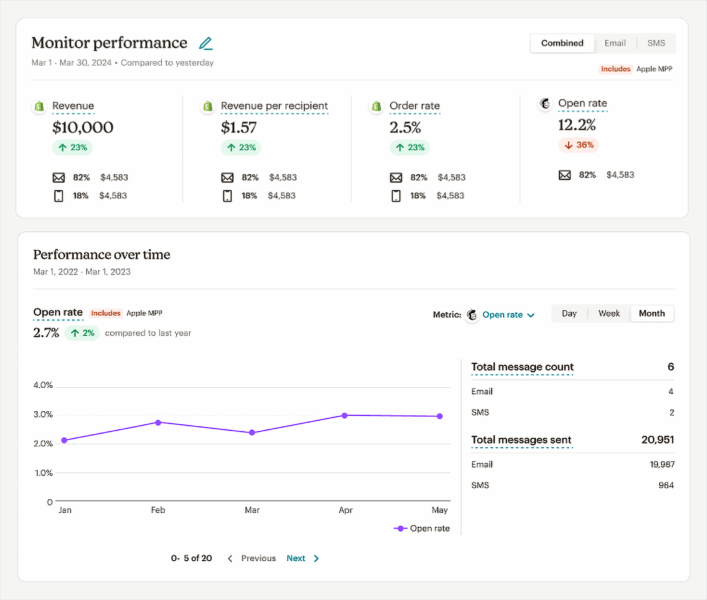
Image source: Mailchimp
Social media
Social media’s impact on revenue is often indirect, making attribution challenging. Focus on engagement quality and assisted conversions rather than follower counts and basic engagement rates.
- Engagement rate trends: Comments, shares, and saves relative to follower growth, which helps you assess the relevance and quality of your content.
- Social-assisted conversions: Revenue influenced by social interactions as a touchpoint, which helps you prove social media’s business impact.
- Reach vs. impressions analysis: Actual audience growth versus algorithmic visibility, which helps you understand whether your content strategy is expanding your audience.
- User-generated content: The quantity and sentiment of user-generated content can be used to assess brand advocacy.
- Social listening sentiment: What people are saying about your brand and how often your brand is mentioned online, which helps you monitor reputation and adjust messaging strategies.
Website and conversion rate optimization (CRO)
Your website is where most conversion decisions are made, making these metrics critical for understanding the effectiveness of user experience. Focus on quality indicators that predict the likelihood of conversion.
- Session quality: Combining time on site, pages per session, and bounce rate helps you assess overall user engagement and content relevance.
- Funnel drop-off: Specific drop-off points and exit pages in the customer journey, which help you identify and fix conversion barriers.
- A/B test lift: Performance differences between test variations, which help you make data-driven decisions about website improvements.
- Page loading speed: How quickly your pages load, which impacts user experience and search ranking performance.
Content marketing
Content often influences purchasing decisions indirectly, making attribution a complex process. These metrics help you understand which content types and topics drive engagement and assist conversions throughout the customer journey.
- Page views: Track traffic volume by content type and topic to identify what resonates with your audience.
- Time on page: Measure content engagement depth and quality. Longer time spent on the page indicates valuable content.
- Scroll depth: The percentage of the page scrolled reveals how much content users actually consume.
- Backlinks earned: The number of organic links earned per piece of content indicates authority and shareability.
- Assisted conversions: Content that influences purchase decisions across the customer journey.

Brand tracking
Brand strength often determines long-term customer value and organic acquisition efficiency. These metrics help you understand brand health and its impact on marketing performance across all channels.
- Direct traffic trends: Website visits from users typing your URL directly, which indicates brand awareness and recall strength.
- Brand search volume: Searches for your company name and branded terms, which helps you measure brand awareness and interest over time.
- Share of voice in paid and organic: Your visibility compared to competitors in search results, which helps you assess your competitive position.
- Social mention sentiment: Qualitative brand perception analysis across social platforms, which helps you monitor reputation and identify potential issues.
- Customer lifetime value by acquisition source: Long-term value of brand-driven customers versus other channels, which helps you understand the quality of different traffic sources.
How to set up a marketing analytics stack
Building an effective marketing analytics stack requires careful planning and integration across four key layers: data collection, processing, visualization, and decision-making.
Data collection layer
Capture every customer action so nothing slips through the cracks.
A robust data collection foundation captures critical customer and performance data from diverse touchpoints in your marketing funnel. This comprehensive approach provides a complete view of customer activities and conversion paths that might otherwise remain invisible in siloed analytics.
- Google Analytics 4 (GA4): Provides on-site behavior data, referral traffic sources, conversion tracking, and basic attribution modeling.
- Google Tag Manager: Centralizes tracking code management and enables custom event tracking.
- CRM system integration: Salesforce and HubSpot can track lead progression, customer interaction data from multiple sources, and customer lifecycle data.
- Advertising pixels: Install platform-specific pixels, such as the Google Ads conversion tracking pixel, Meta Pixel, and LinkedIn Insight Tag, on your site for targeted campaign tracking and retargeting.
- Email platform APIs: Mailchimp, Klaviyo, or Constant Contact collect data based on email performance and subscriber behavior.
- Call tracking software: CallRail provides attribution for phone conversions often missed in digital analytics.
Data warehouse and processing layer
Data centralization is crucial for eliminating siloed reporting that can otherwise occur. You likely have a large and potentially complicated tech stack, and the last thing you need is valuable data being stored separately in each individual tool.
Centralizing data from multiple sources eliminates reporting discrepancies. A single source of data also enables cross-channel analysis, revealing actual marketing performance.
A unified approach helps you identify which channels drive the highest ROI, enabling you to make informed budget allocation decisions based on comprehensive customer journey data.
Data warehouse platforms
Data warehouse platforms store and organize your marketing data for analysis and reporting:
- Google BigQuery: Ideal for organizations already using Google Cloud Platform, with native GA4 integration and strong machine learning capabilities.
- Snowflake: Good for organizations that need cross-cloud flexibility. It’s often favored by SaaS and financial services companies.
- Amazon Redshift: Best choice for AWS-heavy tech stacks, and is particularly common in the eCommerce industry.
Data processing & pipelines
Data processing and pipeline tools move, transform, and prepare your data before it reaches your warehouse:
- Segment: Collects customer data from multiple touchpoints and routes it to your warehouse and other marketing tools.
- Fivetran: Provides automated data connectors that extract data from popular marketing platforms and load it into your warehouse.
- Airbyte: An open-source data integration platform that offers both managed and self-hosted options for connecting marketing tools to your data warehouse.

Image source: Fivetran
Visualization and reporting layer
Clear dashboards and easy visualization can speed up decision-making processes throughout your organization.
Effective data visualization transforms complex analytics into clear insights that drive faster, more informed decision-making across your organization. The right reporting tools enable both detailed analysis for optimization and executive-level dashboards that communicate marketing’s business impact.
- Looker Studio: Free Google tool that integrates seamlessly with BigQuery and GA4 for dashboard customization and reporting visualization.
- Tableau: Advanced visualization capabilities for complex analysis and executive reporting.
- Power BI: Microsoft’s business intelligence platform, ideal for organizations using Office 365.
- Supermetrics: Marketing-specific reporting platform that connects multiple data sources into unified dashboards.
Decision layer and action loops
Data is only valuable if you can use it to drive action.
Connecting analytics insights directly to workflow tools ensures that data discoveries translate into immediate action rather than sitting in reports. This integration enables automated optimization, real-time alerts, and streamlined communication, keeping your team focused on performance improvements.
- Slack integrations: Automated alerts for performance changes and goal achievements in Slack.
- Project management connections: Asana, Monday.com, or Trello integrations that create tasks based on data insights.
- Automation integrations: Tools like Zapier can set up automated tasks, actions, or alerts based on trigger events across different apps.
Implementing the right attribution model for your business
Choosing the right attribution model directly impacts budget allocation decisions and campaign optimization strategies.
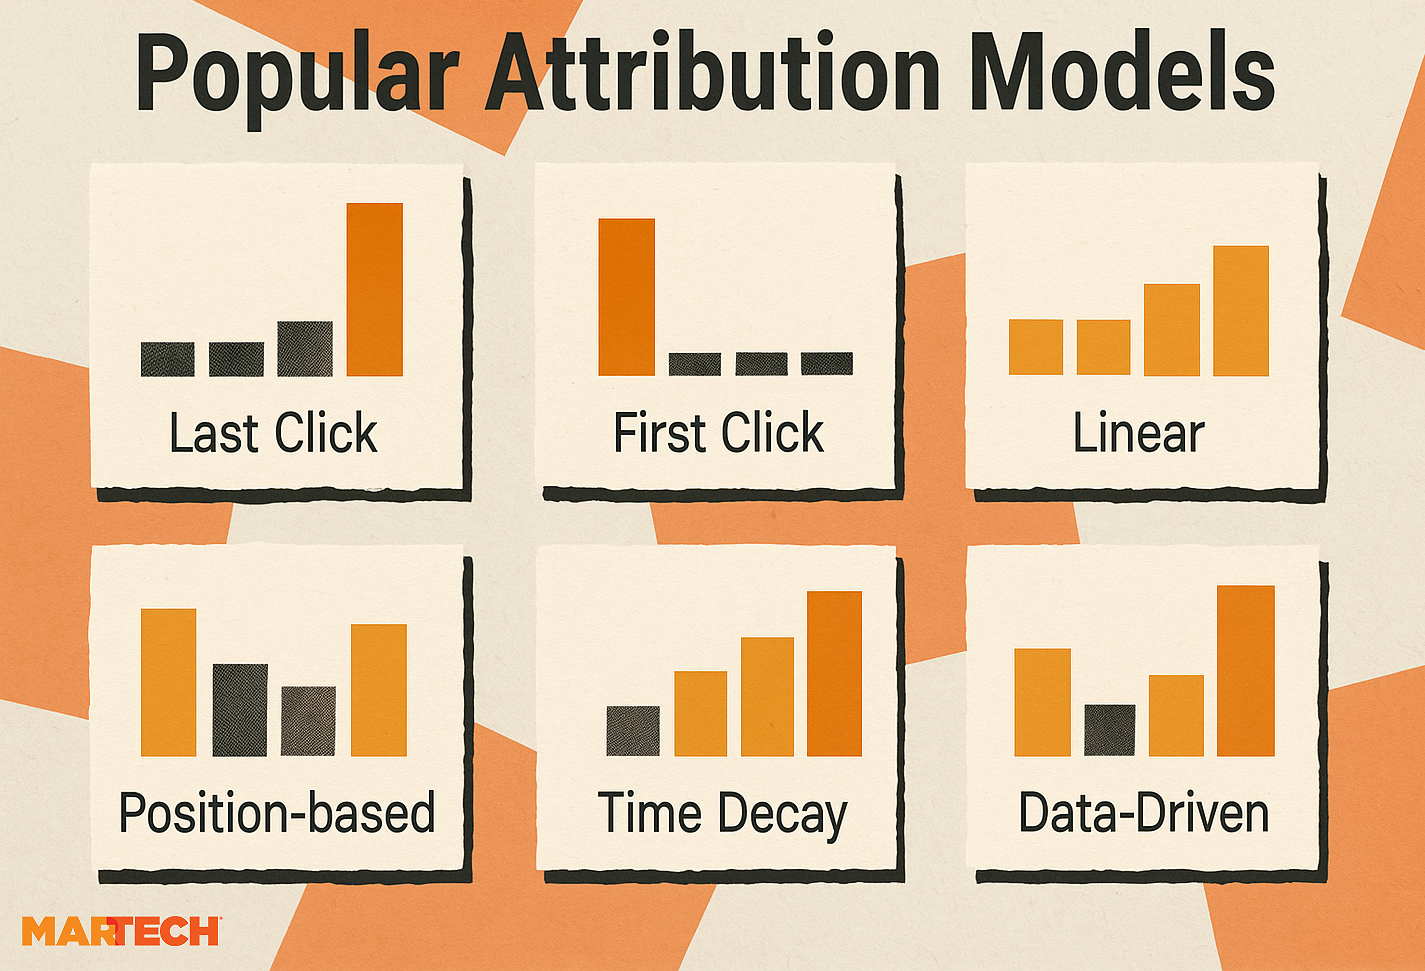
The model you select determines which channels receive credit for conversions, influencing where you invest future marketing spend and how you measure success:
- First-click attribution: Credits the first touchpoint in the customer journey. Helpful in understanding awareness-building activities, but undervalues nurturing efforts.
- Last-click attribution: Attributes conversion to the final touchpoint. Simple to implement, but ignores the multi-touch journey that influences most B2B purchases.
- Linear attribution: Distributes credit equally across all touchpoints. Provides a more complete picture, but may overvalue low-impact interactions.
- Time-decay attribution: Gives more credit to touchpoints closer to conversion. Balances the whole journey while recognizing that recent interactions often have higher influence, but may fail to properly attribute a valuable first-touch experience that captured a customer’s interest.
- Data-driven attribution: Uses machine learning to assign credit based on actual impact. It can be the most accurate on high-volume campaigns, but requires significant data volume and technical expertise.
- Multi-touch with position weighting: Combines approaches by giving higher weight to first and last touchpoints while still crediting middle interactions.
The correct attribution model for your business will depend on your standard customer journey.
For example, a B2B software company with a sales cycle of three to six months may benefit from time-decay attribution or data-driven attribution models. Prospects will have multiple touchpoints over a long period, and these models will give appropriate credit to early touchpoints while recognizing recent interactions, such as demo requests, that trigger final purchase decisions.
Meanwhile, an ecommerce company with a sales cycle that only lasts a few weeks or has fewer touchpoints may benefit from linear attribution. It’s a straightforward model that helps you identify which touchpoints influenced the customer’s decision before they made a purchase.
Marketing analytics challenges—attribution, incrementality, and the measurement gap
Traditional attribution models are failing marketers because they can’t account for the complex, multi-device customer journeys that define modern marketing analytics.
Disrupted by third-party cookie restrictions, dark social, and AI platforms, attribution has become trickier than ever. This creates measurement problems that directly impact budget and strategic decisions:
- Undervaluing awareness campaigns: Upper-funnel channels lose attribution credit.
- Overvaluing bottom-funnel channels: Search appears more effective than it actually is.
- Budget misallocation: Teams shift spend toward channels that capture demand rather than create it.
The solution lies in combining understanding the difference between correlation and true causal impact, knowing when to run controlled experiments, and triangulating insights across multiple attribution methods.
Why incrementality matters more than correlation
Understanding the difference between correlation and true causal impact prevents misallocating budget to channels that appear effective but don’t actually drive additional business. Incrementality can help you understand when correlation is—or isn’t—a coincidence.
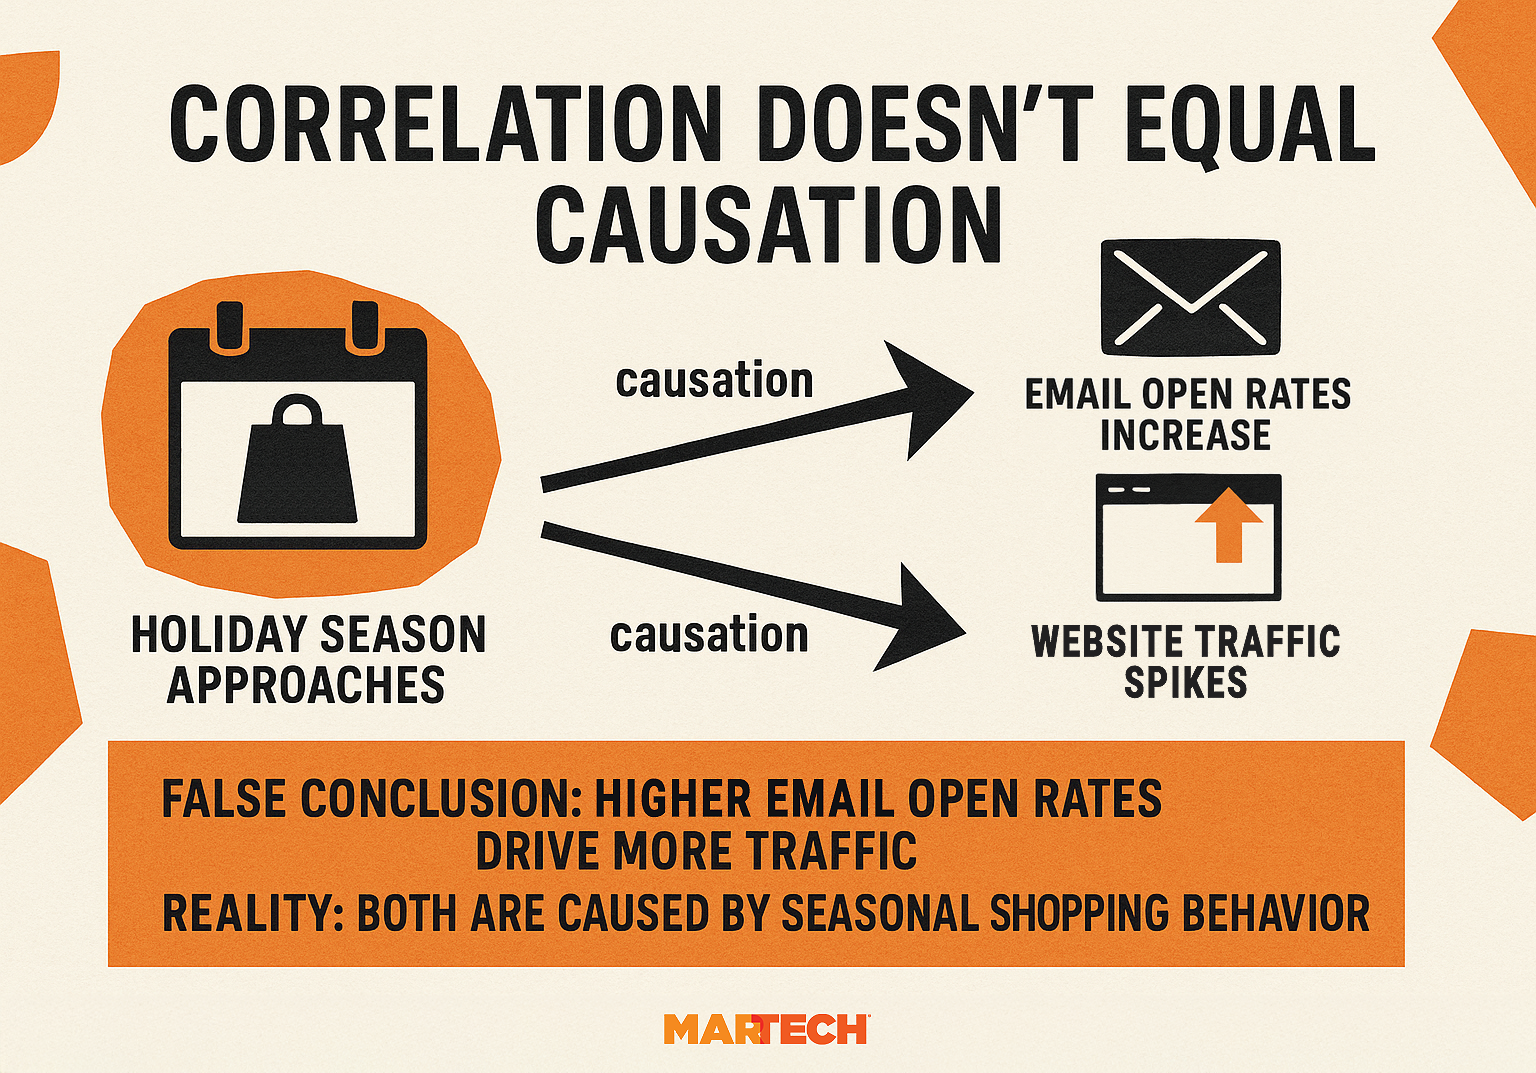
Why correlation can be misleading
Correlation happens when two channels look related, but it may be coincidental.
When ad spend increases and conversions rise simultaneously, it might seem like the additional ad investment is driving results. However, this could be coincidental. Perhaps seasonal demand increased and your competitors became more expensive, which were the actual reasons for your conversions.
It’s essential to remember that correlation can be helpful, but you need to prove what actions are driving results. Incrementality can help with this.
How incrementality can provide clarity
Incrementality measures actual causal lift above baseline performance, showing you the lift against the counterfactual (or what would have happened anyway).
This helps you understand the real impact of your campaigns and marketing efforts, enabling you to make more informed decisions.
Here’s how it works in practice:
Let’s say you run Facebook ads targeting users in Denver but not Phoenix, which are similar segments for your business. Denver’s sales increased 20%, while Phoenix’s grew 5%. The incremental lift from Facebook advertising is 15%, not 20%, as the remaining 5% would have occurred regardless of marketing efforts.
You can track this using Facebook’s built-in Conversion Lift tool, Google’s Campaign Experiments, or Semrush’s Position Tracking Data when assessing branded vs. non-branded queries. You can also export geo-level data into Google BigQuery for custom analysis.
The key takeaway: Incrementality testing helps you separate correlation from causation, allowing you to allocate your budget with confidence.
How to run a lift or holdout test
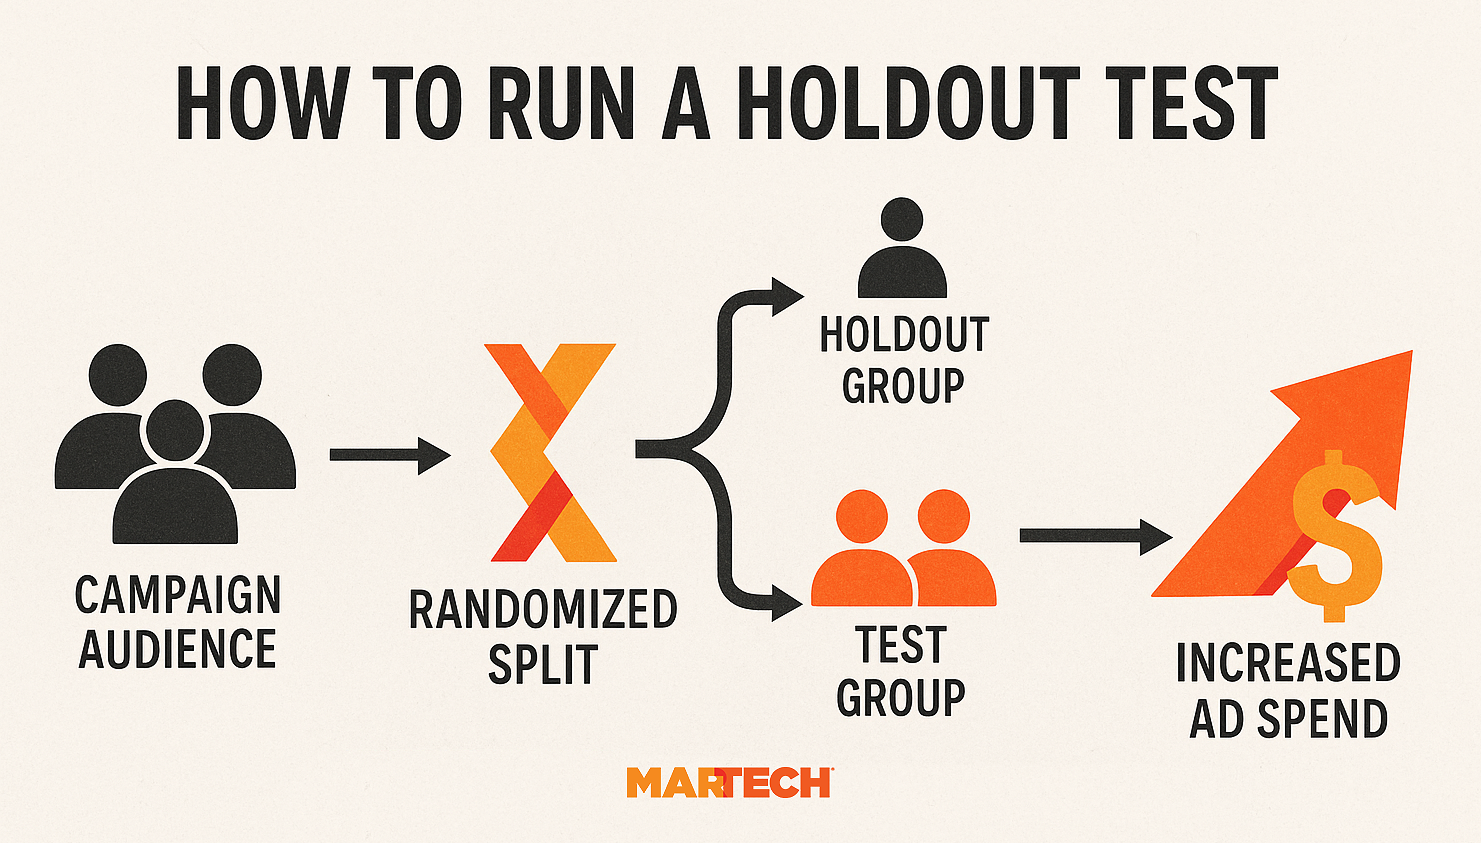
The most reliable way to measure the true impact of marketing is through controlled experiments that isolate the causal effect of your campaigns. These lift and holdout tests reveal whether your marketing drives new business or simply captures demand that would have converted anyway.
Holdout tests withhold marketing spend from a control group while maintaining normal activity in test groups, then compare performance differences to measure incremental lift:
- Choose statistically similar audience segments or geographic regions for your test.
- Run campaigns normally in the test group while completely pausing activity in the control group for a predetermined period. This typically ranges from two to four weeks, depending on your sales cycle.
Geographic experiments
Geographic experiments vary spend levels across different designated market areas (DMAs) to measure incrementality at scale without completely turning off successful campaigns.
For successful tests, pair regions with similar historical performance, demographics, and seasonality patterns, then randomly assign one to receive your test campaign while the other serves as a control.
For example, Seattle gets 150% of its regular budget, Portland receives 50%, while a control group in San Diego maintains baseline spend. You can then determine if increased ad spend is resulting in an influx of sales.
This approach works particularly well for testing new channels, creative strategies, or changes to budget allocation. The key is to ensure that your matched markets truly behave similarly before running the test.
Tools like Meta’s Conversion Lift studies and Google’s Campaign Experiments provide built-in frameworks for running these tests with proper statistical controls.
Pro tip: Test during stable seasons, as holiday spikes or short-term promotions could distort your results.
When to use first-party data vs. modeled data
Different data types serve specific measurement needs, and the most effective analytics strategies combine both approaches strategically.
Why first-party data provides the most reliable attribution
First-party data creates clear, traceable attribution when customers willingly share information with your brand.
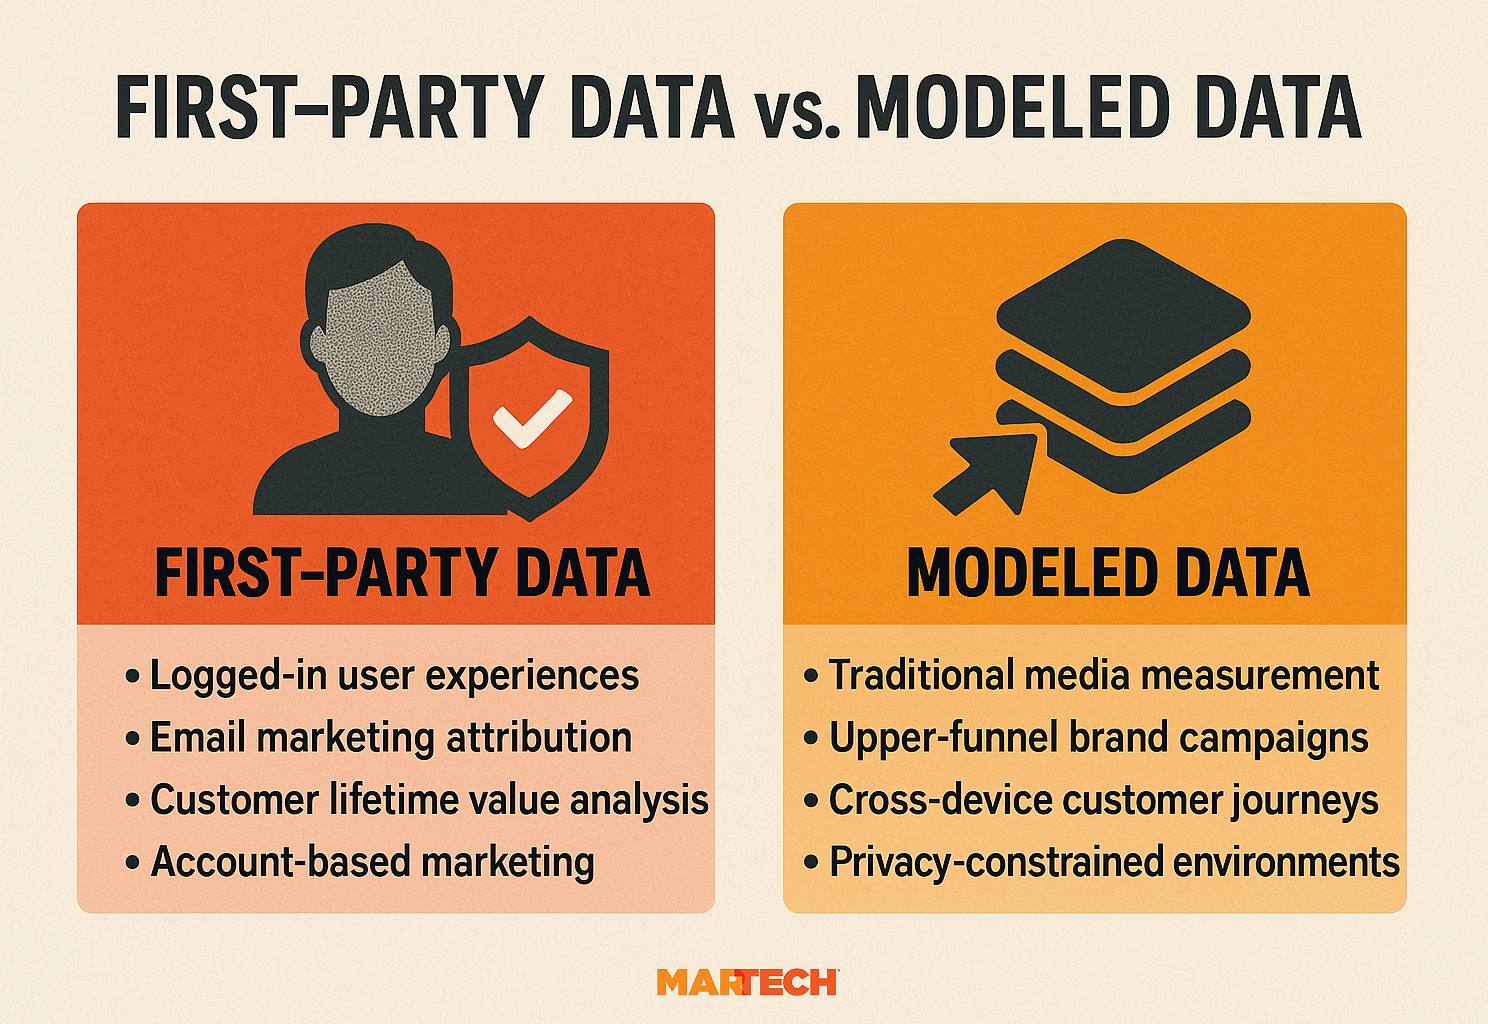
First-party data excels at mapping direct conversion funnels and measuring customer relationships because it doesn’t rely on third-party cookies or cross-site tracking. It works best for:
- Logged-in user experiences: Track customer behavior across multiple sessions and devices.
- Email marketing attribution: Connect email engagement to website behavior and conversions.
- Customer lifetime value analysis: Monitor repeat purchases and expansion revenue over time.
- Account-based marketing: Track multiple stakeholders within target accounts.
You can use Semrush’s CRM integrations with HubSpot or Salesforce connectors for first-party attribution use cases.
How modeled data fills critical measurement gaps
Modeled data becomes essential when user-level tracking fails due to privacy restrictions, cross-device complexity, or offline interactions.
Marketing Mix Modeling (MMM) methods use aggregate data patterns to estimate the marketing impact when individual-level tracking breaks down. They work best for:
- Traditional media measurement: TV, radio, and print advertising, with limited digital tracking capabilities.
- Upper-funnel brand campaigns: Awareness initiatives that influence conversions indirectly over time.
- Cross-device customer journeys: When customers research on mobile but purchase on desktop.
- Privacy-constrained environments: iOS 14.5+ tracking limitations and GDPR compliance requirements.
A CPG brand, for example, might use MMM to measure the impact of TV advertising on sales across more than 200 retail locations. The model correlates TV ad spend timing with sales spikes, accounting for seasonality, promotions, and weather patterns to isolate true TV incrementality.
This approach works because individual customer tracking isn’t possible for TV advertising, but aggregate sales patterns reveal clear cause-and-effect relationships.
Why triangulation works better than chasing perfect accuracy
No single attribution method tells the complete story. The most effective analytics strategies combine the triangulation of first-party data, modeled data, and incrementality testing to identify convergent patterns, rather than relying on a single measurement approach.
Here’s why this works: Each attribution method has inherent biases:
- Multi-touch attribution gives too much weight to digital touchpoints.
- Marketing Mix Modeling smooths out short-term variations.
- Incrementality testing can miss interaction effects between channels.
| Attribution method | Primary bias | What it over-emphasizes | What it under-values | Impact on budget decisions |
| Multi-touch attribution | Digital touchpoint bias | Trackable digital interactions (clicks, emails, social engagement) | Offline touchpoints, word-of-mouth, brand awareness campaigns | Shifts budget toward lower-funnel digital channels that appear to “drive” conversions |
| Marketing mix modeling | Smoothing bias | Long-term trends and aggregate patterns | Short-term campaign performance and daily optimization opportunities | Can miss tactical improvements and real-time campaign adjustments |
| Incrementality testing | Isolation bias | Individual channel performance in controlled conditions | Cross-channel synergies and interaction effects between campaigns | May underestimate the combined impact of integrated marketing campaigns |
Triangulation works, therefore, because you can benefit from all models while reducing the bias of each. For example, by triangulating different methods, you may realize:
- Multi-touch attribution reveals that paid search drives the majority of conversions.
- MMM indicates paid social delivers the highest ROI.
- Lift tests reveal that email generates the most significant incremental impact.
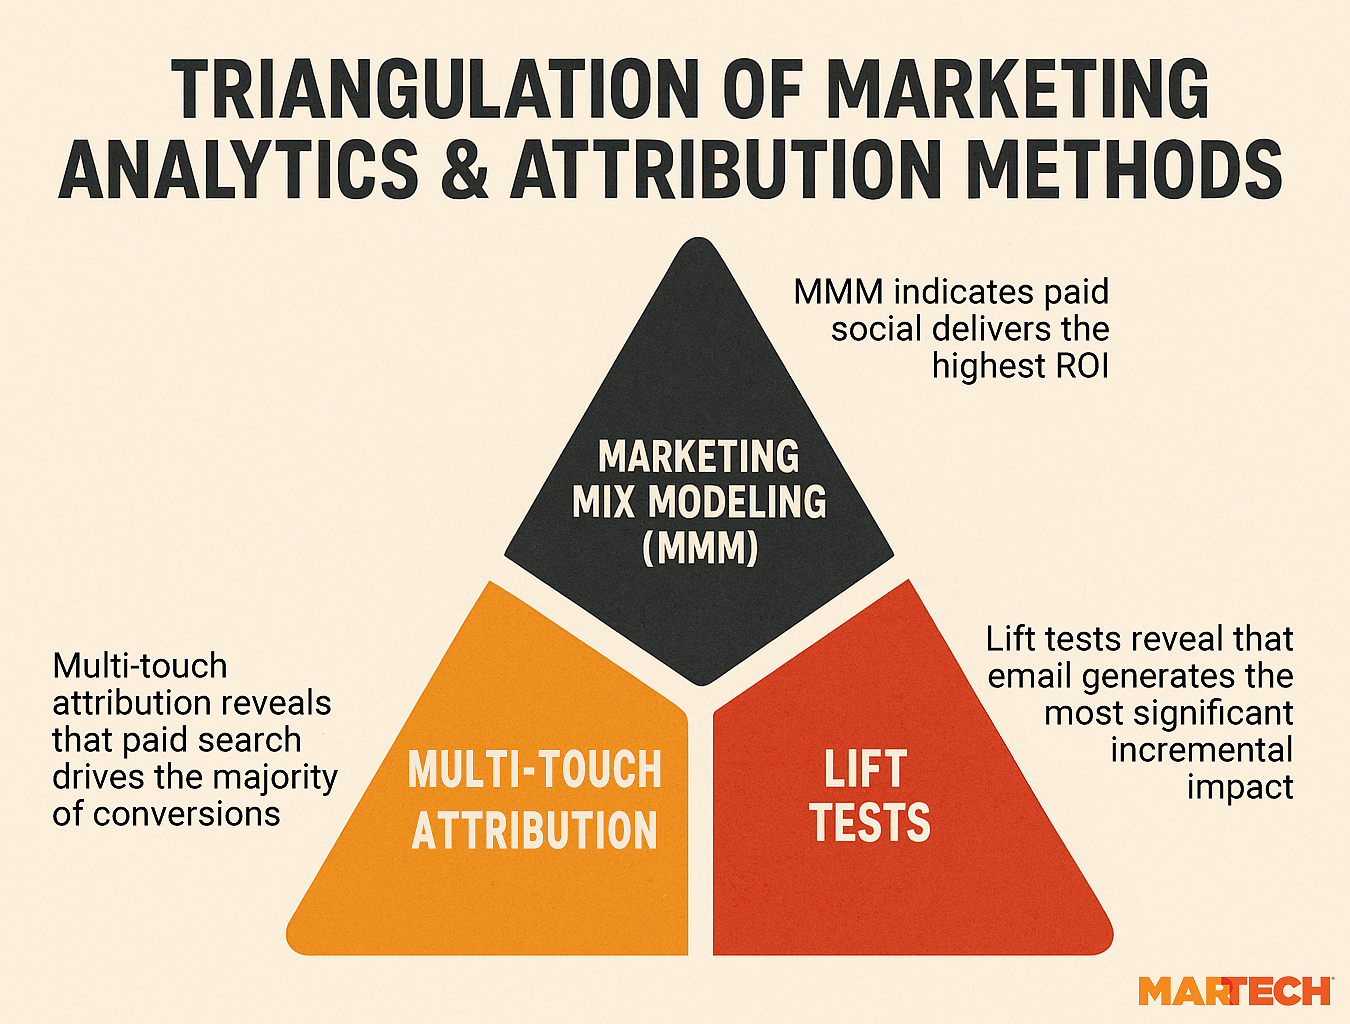
The actual takeaway? Paid search captures demand, paid social builds awareness efficiently, and email converts warm prospects effectively.
For best results, use this triangulation methodology:
- Cross-validation: Compare results across different attribution methods to identify consistent patterns
- Confidence intervals: Use statistical ranges rather than point estimates when making budget decisions
- Scenario planning: Model different attribution assumptions and their business impact before major budget shifts
- Regular calibration: Update attribution models based on incrementality test results to improve accuracy over time
The right tech stack can help. Tools like Traffic Analytics and Market Explorer can provide supporting competitive benchmarks to cross-check your attribution assumptions.
When your different attribution methods yield conflicting data, investigate the differences rather than picking one result. Doing so often reveals opportunities to optimize the customer journey or uncovers measurement blind spots that need addressing.
Marketing analytics for different business models
Measuring the wrong metrics wastes budget. Tailor your analytics to your business model to see how customers really buy—and optimize accordingly
B2B marketing analytics
Long sales cycles require sophisticated lead attribution and pipeline influence tracking.
B2B buyers’ research can span from weeks to months. They often interact with multiple touchpoints before converting, which can make attribution more challenging to track. Focus on these critical measurements:
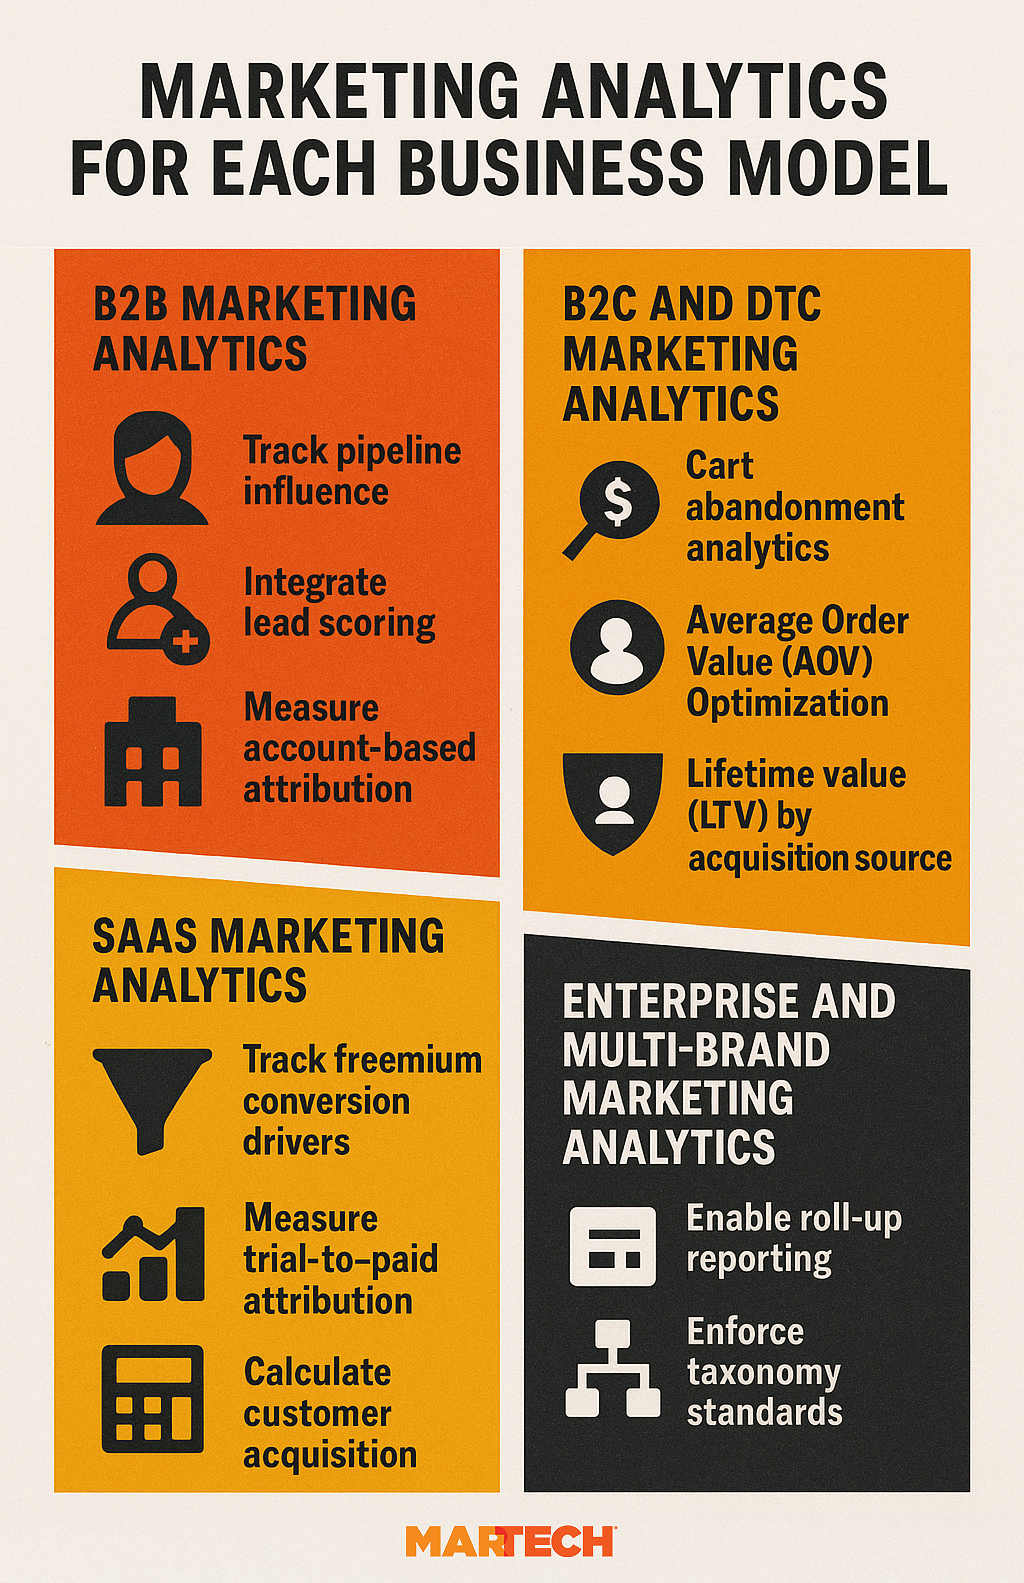
- Track pipeline influence: Show how webinars, content downloads, retargeting, and outreach campaigns move deals through the sales funnel.
- Integrate lead scoring: Combine demographic and behavioral intent signals to prioritize high-value prospects.
- Measure account-based attribution by mapping multiple stakeholders across IT, procurement, and executive decision-makers.
B2C and DTC marketing analytics
Shorter purchase paths and higher transaction volumes allow for more granular conversion optimization.
Because B2C customers often convert within days or weeks, it is essential to focus on conversion rate optimization (CRO) and average order value (AOV). Here’s what to measure to optimize conversions and revenue:
- Cart abandonment analytics: Track which campaigns recover the most abandoned purchases using incremental lift tests.
- Average Order Value (AOV) Optimization: Test how product recommendations, bundle offers, and pricing strategies impact AOV.
- Lifetime value (LTV) by acquisition source: Segment customers by their discovery channel and assess LTV..
SaaS marketing analytics
SaaS businesses need to connect marketing activities to both acquisition and expansion revenue. They need to track the entire customer lifecycle from trial signup through renewal and upselling:
- Track freemium conversion drivers: Identify which onboarding flows or campaigns predict upgrades.
- Measure trial-to-paid attribution: Compare how acquisition sources influence trial quality and conversion rates.
- Calculate customer acquisition costs (CAC): Tie customer acquisition costs and net revenue retention (NRR) metrics back to specific marketing channels.
Enterprise and multi-brand marketing analytics
Large organizations need standardized measurement frameworks that enable comparison across regions, brands, and product lines, including:
- Enable roll-up reporting: Aggregate data across brands and markets while maintaining drill-down options.
- Enforce taxonomy standards: Use consistent UTMs, channel definitions, and KPI formulas globally.
- Compare regional performance: Benchmark North America vs. EMEA markets to identify efficiency gaps and scalable best practices. How to build a marketing analytics culture
Building a marketing analytics culture ensures insights actually influence daily work rather than sitting in unused dashboards, transforming how your organization allocates spend and optimizes campaigns.
Democratize data access with self-serve dashboards
Most marketing teams waste time waiting for analysts to answer basic questions, slowing down optimization decisions and campaign adjustments.
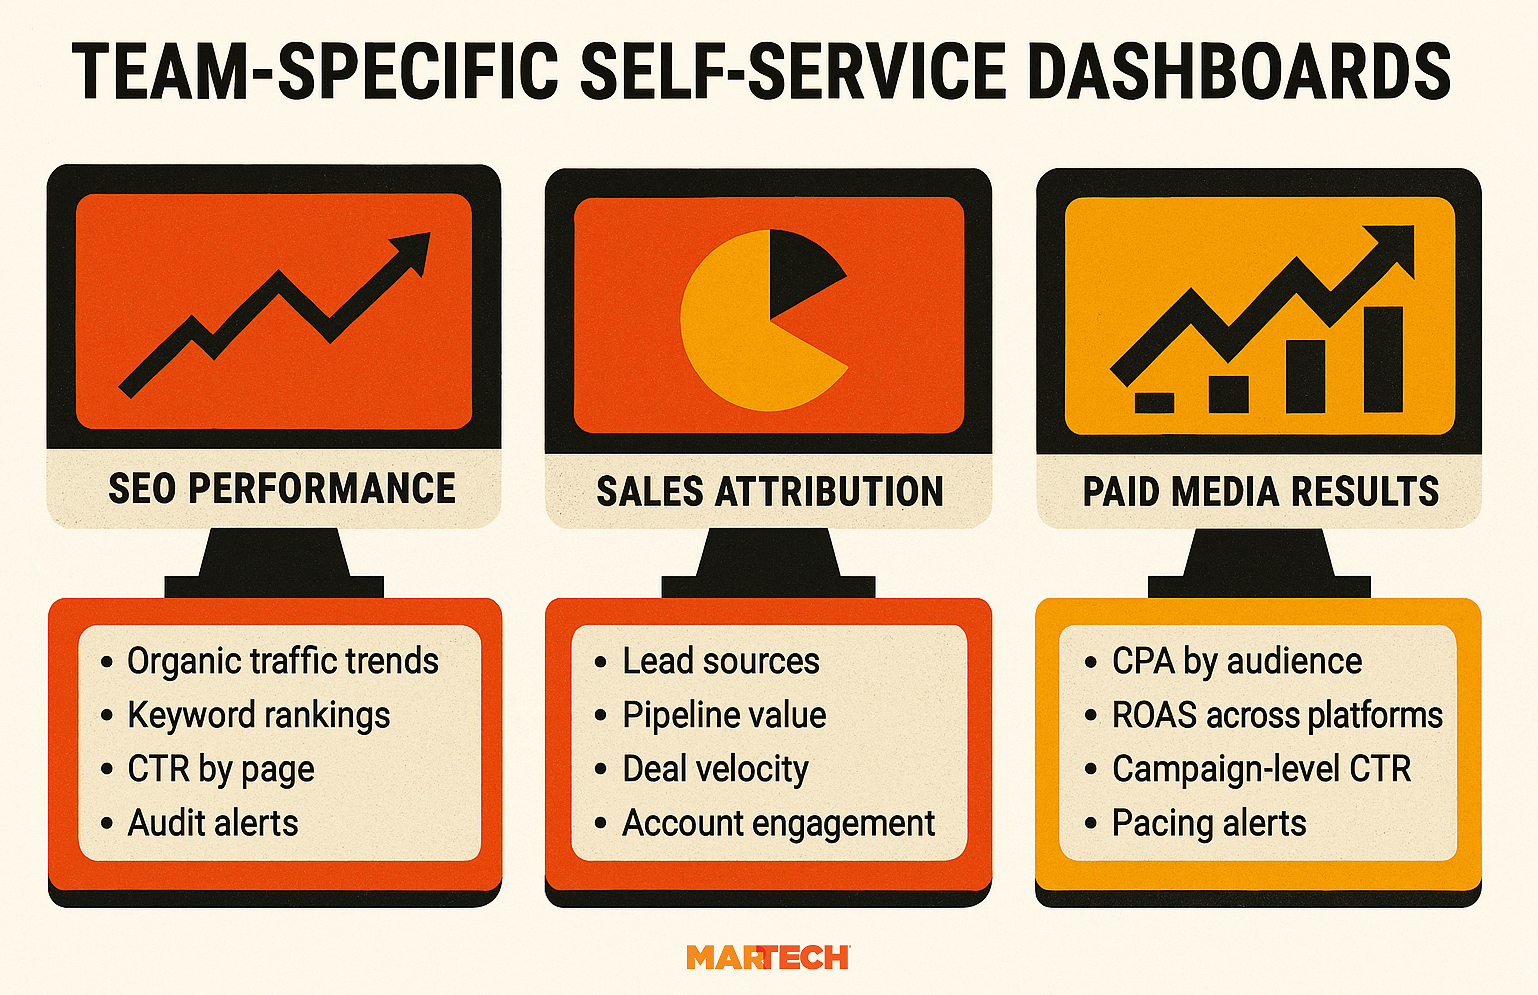
Create Looker Studio or Tableau dashboards with role-specific filters. Building role-specific dashboards that give each team immediate access to the metrics they need for daily decisions:
- Show SEO performance: Organic traffic trends, keyword rankings, CTR by page, and audit alerts.
- Visualize sales attribution: Lead sources, pipeline value, deal velocity, and account engagement.
- Track paid media results: CPA by audience, ROAS across platforms, campaign-level CTR, and pacing alerts.
Pro tip: You should also leverage natural language query tools to make data accessible to all key end users. Implement systems that enable users to ask questions such as “Which email campaigns drove the most trial signups last month?” or “Show me conversion rates by traffic source this quarter” without requiring SQL knowledge.
Appoint analytics champions in each department
Without subject matter experts bridging the gap between analytics and business teams, insights get lost in translation, and data quality suffers from poor tracking implementation.
Identify and empower data-savvy team members to become the analytics bridge between departments and your central data team:
- Recruit existing power users: People already building analyses or asking data-driven questions make the best champions.
- Define clear responsibilities: Champions own UTM hygiene, train teammates, and translate insights.
- Provide ongoing training: Monthly sessions ensure that skills stay sharp and valuable insights are shared.
- Create feedback loops: Champions flag data issues and suggest new metrics for monitoring. Champions help bridge the gap between dedicated analytics teams and day-to-day decision-making, thereby increasing the likelihood that insights will be effectively implemented.
Build rituals to ensure consistency
Ad-hoc analytics reviews lead to reactive decision-making and missed optimization opportunities when performance issues aren’t caught early.
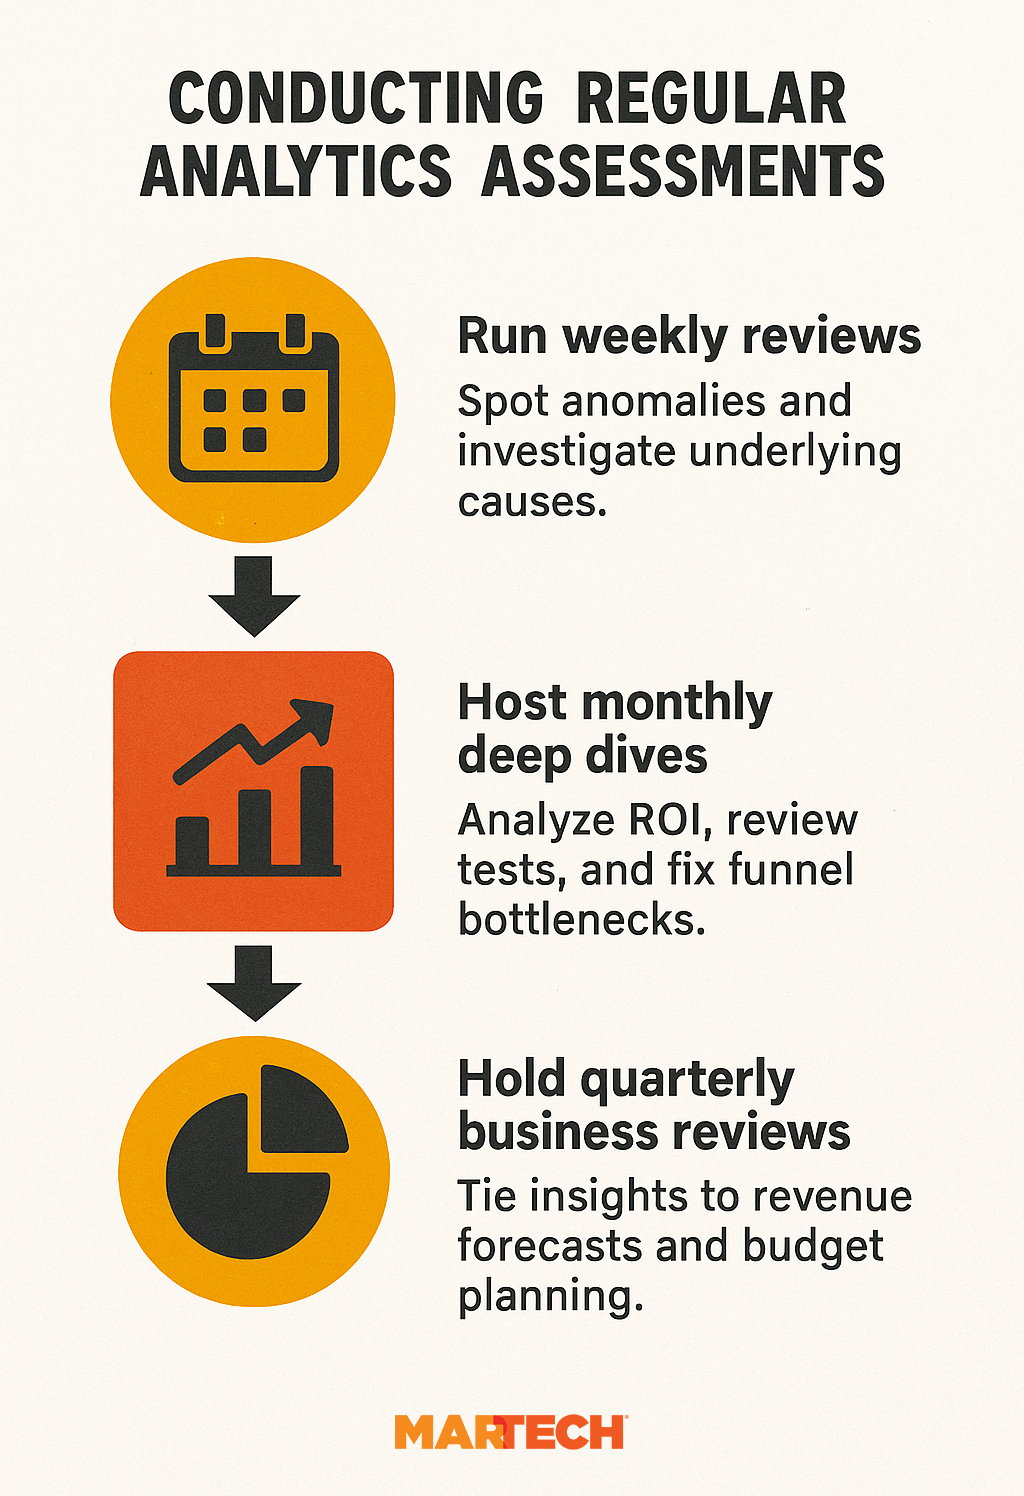
Create structured touchpoints that turn analytics insights into budget decisions and campaign optimizations:
- Run weekly reviews: Spot anomalies and investigate underlying causes.
- Host monthly deep dives: Analyze ROI, review tests, and fix funnel bottlenecks.
- Hold quarterly business reviews: Tie insights to revenue forecasts and budget planning.
Regular analytics rituals prevent performance issues from becoming budget disasters by catching problems early and identifying areas for optimization.
Reward learning, not just winning
Teams that only celebrate successful tests avoid risky experiments that could reveal breakthrough optimization opportunities. The last thing you want is for your team to be sandbagging riskier tests because they’re afraid of what they’ll find.
Create a culture that values insights over outcomes by celebrating experiments that generate useful learnings, regardless of performance results:
- Document all test results: Maintain a shared knowledge base for both wins and losses.
- Acknowledge valuable failures: Recognize tests that revealed key insights, even if conversions were underwhelming.
- Share learnings across teams: Monthly presentations prevent repeating mistakes
- Reward hypothesis quality: Judge on rigor and insight, not just outcomes.
This approach builds a culture of experimentation that can fuel authentic learning, as opposed to driving a fear of failure.
Avoid reporting theatre, get actionable insights
Too many organizations create impressive dashboards that nobody uses for actual decision-making, wasting resources on vanity metrics instead of actionable data.
Audit your current reporting to ensure every metric connects to specific business decisions and actions:
- Apply the three-question test: For each dashboard, ask who uses this data, what decision it informs, and what happens when numbers change. If you can’t answer clearly, remove that metric.
- Assign metric owners: Every chart needs a specific person responsible for acting on the data. Page views without an owner become vanity metrics, but page views owned by the content team drive editorial calendar decisions.
- Link metrics to actions: Connect each KPI to predetermined responses. If email open rates drop below 18%, the marketing team tests new subject lines. If the cost per acquisition exceeds $200, pause that campaign immediately.
- Eliminate executive eye candy: Remove metrics that exist solely to impress leadership but don’t influence operational decisions. Replace follower counts with engagement rates that actually inform content strategy.
This approach transforms analytics from a reporting exercise into a decision-making tool that actually drives performance improvements.
Start measuring what matters
Marketing analytics success isn’t about having the most sophisticated tools. Instead, it’s about asking the right questions and measuring what actually drives business outcomes.
Focus on building a measurement framework that connects marketing activities to revenue, enables cross-channel optimization, and provides the insights your organization needs to prove marketing’s impact and optimize future investments.
You want to understand your business objectives and determine how to track progress:
- Start with your business objectives. Define outcomes first, then choose data sources and measure
- Prioritize integration over perfection. Choose a connected, simple analytics platform; it will beat isolated, complex tools any day.
- Invest in attribution early. Understand how touchpoints influence conversions to prove ROI and inform budget allocation.
Dig deeper: Ready to build a marketing analytics strategy that drives real business results? Learn more about what your attribution model isn’t telling you so you can find solutions to get a comprehensive understanding of what’s actually happening with your customers.
New on MarTech