The Quiet, Smart Growth Of #GirlsWhoCode
Columnist Chris Kerns takes a look at how the nonprofit is quietly becoming a game changer — and why focusing on the right numbers is key to measuring your own success.

For marketers, knowing what to measure after a campaign goes live has been a difficult question to answer for decades. With so many channels, metrics, tools and spreadsheets to fill out, it can get overwhelming pretty fast.
What numbers are the best gauge of your success? When do you declare victory or defeat on a campaign? And how do you know when you’re looking at the wrong number?
Usually, you don’t.
The key to a good measurement process is focusing on the number that will drive your business — not the easy numbers to get, but the right numbers. Sometimes a quieter story can speak volumes about bottom-line results.
Need proof? Let’s take a look at the progress of a game-changing social movement called Girls Who Code.
The Girls Who Code Movement
Girls Who Code is a national nonprofit organization whose goal is to close the gender gap in the technology world. They focus on empowering young women through engineering, computer science, and all sorts of cool, geeky stuff.
It’s a great organization and an important cause. They’re also very active on social media, working hard to spread their message with the help of brands and celebrities.
AT&T has been a big supporter of Girls Who Code.
@GirlsWhoCode Hats off to the #GirlsWhoCode Graduates! ?
— AT&T (@ATT) July 29, 2015
. @EA Chief Talent Officer Gaby Toledano inspired our #GirlsWhoCode class to pursue their passions! pic.twitter.com/QJD8F7FyiI
— Electronic Arts (@EA) July 28, 2015
And here’s Amy Poehler’s pioneering organization, Smart Girls, chiming in on social to support the group.
Interview: Reshma Saujani, Founder & CEO of Girls Who Code // http://t.co/S7sJeGB5ao pic.twitter.com/v5i63Ckl5c
— AmyPoehlerSmartGirls (@smrtgrls) October 16, 2015
So while we can see a lot of participation from influencers, how can we tell if the organization is making a difference?
The Simplest Measurement Solution Is Sometimes The Wrong One
The easiest way to check the success of Girls Who Code on social media would be to track mentions of the term (and associated handles and hashtags) over time. By doing so, we can see if awareness and conversation are increasing.
After grabbing the data for Twitter mentions over the past eight months, here’s how that view looks:
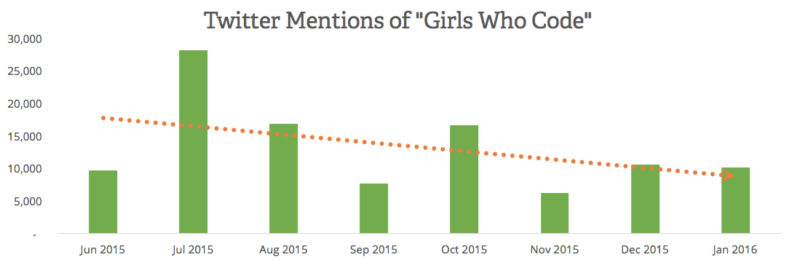
As you can see, a view of the overall conversation around “Girls Who Code” looks spiky, but also like it is declining, with a peak back in July of 2015. Many data teams would stop at this point and sound the alarm bells.
I can hear the panic from here: We’re becoming less relevant! Do a big ad buy! Everybody freak out!
But after diving deeper into the data, I think that Girls Who Code is actually headed down the right path. Let me show you what I mean.
Be Curious About The Story Within The Story
We’ll begin to explore the data not by looking at the raw number of social mentions per month, but at the unique users talking about Girls Who Code.
The “unique user” measurement tracks the population of people talking about a subject and tosses out repeat mentions each month. (For example, if I tweeted about Girls Who Code three times in January, that would count as three mentions, but I’m only one unique user.)
By running these numbers, we can get a view of the unique count of people talking about the group each month, seen below:

By switching the view from Twitter mentions to Twitter unique users talking about the subject, we level out the momentum a bit. The month-by-month data is still a bit spiky, but at least the trend line isn’t heading downhill.
Still, based on the data as we see here, it looks like the cause may be simply treading water on social media.
That is, until we bring in one more dimension of data.

What I was really interested in was not just the overall mentions of Girls Who Code, but how many women are mentioning the group month over month.
When we jump into the Spredfast Intelligence tool (Disclosure: Spredfast is my employer) and take a look at the gender breakdown behind the Twitter users talking about the group, things start to get very interesting.

The first takeaway from our gender data is that the majority of people talking about Girls Who Code are men. And it’s a pretty serious majority, going back as high as 94 percent in July of 2015.
But the more interesting finding is how that is changing, month over month. As of January 2016, women now make up 24 percent of the share of voice around the topic of “Girls Who Code,” and it’s getting bigger and bigger each month.
Now we’ll do something that I’m sure the good people over at Girls Who Code will appreciate: We’ll do some math.
If we combine the view of unique users and the gender population from each month, we can see not only how many people are talking about Girls Who Code, but how many women are talking about the group.
Here’s that view:
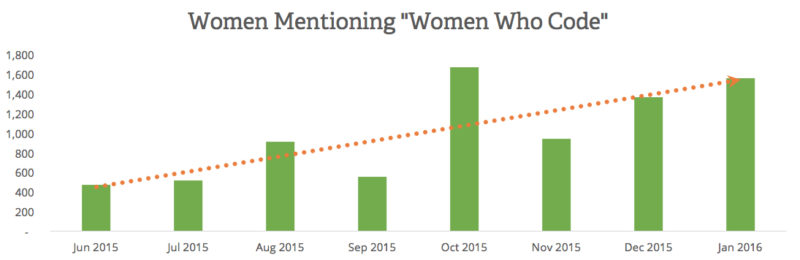
While overall Twitter conversation on the subject is down from June 2015, the level of conversation from women talking about the subject is up more than 330 percent. That’s a ridiculous amount of growth in just eight months.
If Girls Who Code isn’t only trying to raise overall awareness, but also looking specifically to raise the levels of conversation by women, then they are doing an amazing job. And isn’t the first part of change always awareness with your core group?
Always Look Beyond The Simple Solution
Sometimes, top-level metrics are best to lean on for reporting on campaigns and success. Let’s face it — big, easy-to-understand numbers are simple to grab from a tool, they’re easy for our audience to understand and cutting and pasting them into a spreadsheet without thinking twice allows us get back to our busy lives.
But by asking the second and third question, and diving into the data behind the data, you can sometimes find the real story behind the numbers. Remember when setting up your measurement plan: Always ask yourself what specifically you’re trying to achieve, not just what is easy to report on.
Note: if you’re interested in getting involved with Girls Who Code, you can find out more on their website.
Opinions expressed in this article are those of the guest author and not necessarily MarTech. Staff authors are listed here.
Related stories
About the author