Marketing Stats Toolbox: Mobile Activity By City To Keep You Ahead
Columnist Andrew Waber shares data from a recent study by Cidewalk and Chitika Insights on mobile activity by city.

“Location, location, location,” the long-time axiom of the real estate market — and, more recently, one of the largest trends in online marketing with its inexorable tie to mobile. Yet, while industry practitioners largely understand the myriad benefits of localizing campaigns, it seems the growth of inventory, the corresponding importance of real-time bidding (RTB) exchanges, and the increasing number of buyers have made navigating the environment slightly more tricky.
One major question that often factors into discussions around campaign localization for national brands is this: Which cities currently present the biggest bang for the buck?
To help answer this question, the Cidewalk and Chitika Insights team examined hundreds of millions of U.S.-based mobile ad impressions running across multiple RTB exchanges. Impressions analyzed were those served across the ad exchanges between March 18 and 24, 2015, coming from users of mobile apps which included a location identifier. We then segmented these data by city.
Of course, more populous cities tended to demonstrate higher impression counts than cities with lower populations. However, this wasn’t across the board, and looking at these data on a per capita basis reveals some interesting trends.
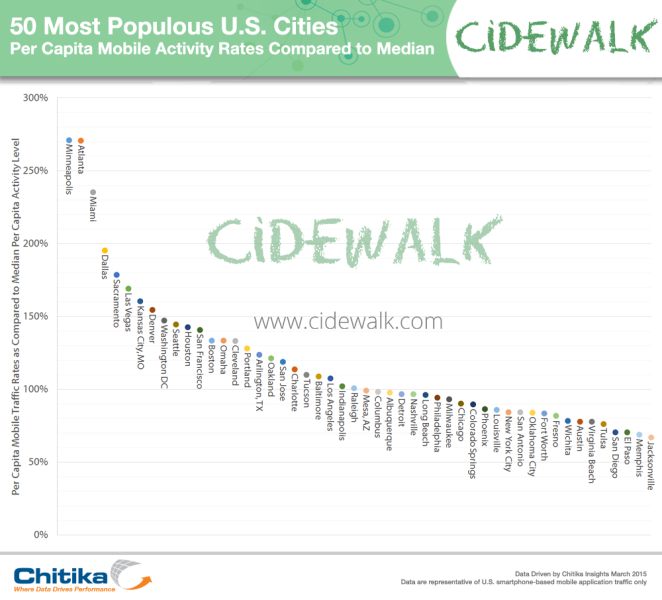
Focusing on the 50 most populated U.S. cities, the results point to cities whose aggregate user bases are substantially more active on mobile devices, and those which are decidedly less active on a per capita basis:

It is worth noting that the top three cities — Minneapolis, Atlanta, and Miami — all possess major hub airports which fall within the city limits. Additionally, these cities boast populations towards the bottom of the group of 50 we were examining, making the impact of the large daily influx of travelers much greater.
This presumably layover-laden phone usage dramatically changes the inventory available in these cities, which in each case, either matches or exceeds the inventory available in population centers like Boston, Las Vegas, and Washington, D.C.
Depending on an advertiser’s given industry or target market, this glut of transient users presents either a blessing or a curse. One major issue is that brands who are looking to promote area stores or services may be reaching a sizable number of users who have no possibility of ever visiting them.
On the other hand, these fly-by-night users represent a group that is actively engaged with their devices and looking to kill time. For some ecommerce and national entities that have a more universal message, this could be an ideal audience.
The commonalities among the bottom-most cities aren’t quite as evident, although in comparison to the upper-most cities, they are much closer to the median per capita usage rate. Last-place Jacksonville exhibits per capita usage rates that are 67% of the median value. Meanwhile, first-place Minneapolis demonstrates usage rates that equate to 271% of the median value.
This underscores two points: (1) in the majority of largest U.S. population centers, per capita mobile usage doesn’t vary significantly, and (2) confidently buying ad inventory tied to large cities requires a detailed touch.
In many cities, incorporated neighborhoods lying right next to one other may exhibit wildly different demographics — Washington, D.C., being one prominent example. Additionally, inventory spread out across expansive cities like Houston and Los Angeles may lose its local applicability.
At a high level, these statistics are absolutely worth keeping in mind when crafting a localized ad-buying strategy. Cities exhibiting remarkably high per capita usage rates are worth investigating further to determine their applicability and whether any further segmentation is necessary to achieve your goal.
Of course, the amount of inventory available in Minneapolis or Atlanta will impact prices on RTB exchanges, but any increased buying power needs to be weighed against the potential for waste.
Opinions expressed in this article are those of the guest author and not necessarily MarTech. Staff authors are listed here.
Related stories
About the author