Google’s Quality Score Change: What Marketers Need To Know
Last week, Google announced changes in the way Quality Score is reported in AdWords. As stated in Google’s official AdWords blog, the update changes the way each keyword’s 1-10 numeric Quality Score is reported. Quality Score is a metric in paid search that represents the relevancy of an ad with respect to the search query, […]
Last week, Google announced changes in the way Quality Score is reported in AdWords. As stated in Google’s official AdWords blog, the update changes the way each keyword’s 1-10 numeric Quality Score is reported.
Quality Score is a metric in paid search that represents the relevancy of an ad with respect to the search query, affecting the rank and cost-per-click (CPC) of ads within the auction. (For more detailed information, there is an excellent article on Search Engine Land giving an overview of the history and mechanics behind Quality Score.)
Google states that the recent change only affects the 1-10 numeric “visible” Quality Score reported in AdWords, which is different from the actual impression-level Quality Score used for auction rank and CPC calculation.
To assess the impact of this development, I analyzed the pre/post change in Quality Score distribution across data for more than 100 advertisers.
Upward Shift In Quality Scores
Since the exact range of scores differs for every advertiser, we looked at the percentage change in relative impression volume (proportion of total impressions) at each Quality Score level from 1 to 10. I found that Quality Scores rose overall, with the proportion of 1s, 2s, and 3s decreasing significantly for many accounts, while the number of 10s increased.
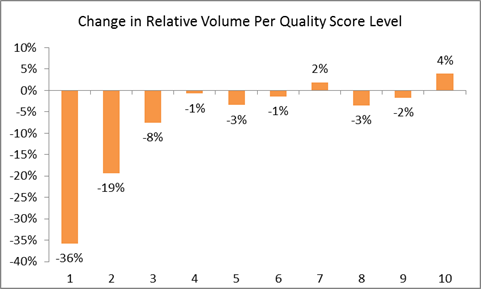
Though the percentage change appears much larger for lower Quality Scores in the chart above, this is just due to the limited volume of keywords and impressions with scores of 1, 2, and 3.
Quality Score Change Per Vertical
There was some variation in results across verticals, but overall patterns remained similar.
- Quality Scores increased, with a shift from lower scores to higher scores. In particular, the proportion of 1s and 2s decreased dramatically, along with an increase in number of 10s.
- 4s, 7s, and 10s seem to be more favored in the new calculation.
- The effect on 8s and 9s varies by vertical, rising for most but dropping for finance.
|
Vertical |
Change in Volume per Quality Score Level |
|||||||||
|
|
1 |
2 |
3 |
4 |
5 |
6 |
7 |
8 |
9 |
10 |
|
Retail |
-50% |
-13% |
-12% |
-2% |
-4% |
-2% |
0% |
2% |
4% |
1% |
|
Finance |
-34% |
-26% |
-3% |
2% |
-3% |
-1% |
1% |
-7% |
-6% |
5% |
|
Automotive |
-7% |
-10% |
-3% |
2% |
-3% |
-2% |
-4% |
3% |
2% |
-1% |
|
Education |
-15% |
-27% |
-3% |
2% |
1% |
-5% |
12% |
6% |
1% |
6% |
|
Technology |
-9% |
-29% |
-11% |
2% |
2% |
2% |
4% |
-16% |
5% |
6% |
|
Overall |
-36% |
-19% |
-8% |
-1% |
-3% |
-1% |
2% |
-3% |
-2% |
4% |
Is The Change For The Better?
According to Google, the new calculation “will tie your 1-10 numeric Quality Score more closely to its three key sub factors — expected clickthrough rate, ad relevance, and landing page experience.” This statement by itself means very little, since what matters to advertisers is how representative the visible Quality Score is of actual performance.
Previous research has shown the effect of a unit change in Quality Score on CPC is larger at lower score levels. If this is true, it makes sense for the range of Quality Scores to be transformed (shifted up, with the lowest ranges seeing the most impact), bringing the scores closer to a linear relationship with respect to CPC impact.
However, the shift toward higher Quality Scores may also cause them to be less useful to marketers. 1’s, 2’s, and 3’s tend to already appear far less compared to 10’s for most advertisers, and the visible Quality Score cannot go any higher than 10. With the decreased range, any change to Quality Scores will also become harder to detect.
Key Takeaways
Google states that this change will affect the visible Quality Score only, which means that there should be no impact to your account performance.
However, there does seem to be a definite, if small, effect on the distribution of Quality Scores. This means the baseline will change for most accounts, and any ongoing A/B tests involving Quality Score improvement will need to be redone.
- The baseline Quality Scores for most accounts is likely to rise due to the overall upward shift.
- It remains to be seen whether the new calculation is more or less reflective of actual performance impact compared to legacy scores.
- If you are currently conducting an ad copy or landing page test to assess impact on Quality Score, you will need to repeat it, since this change will invalidate any results.
Opinions expressed in this article are those of the guest author and not necessarily MarTech. Staff authors are listed here.
Related stories
About the author